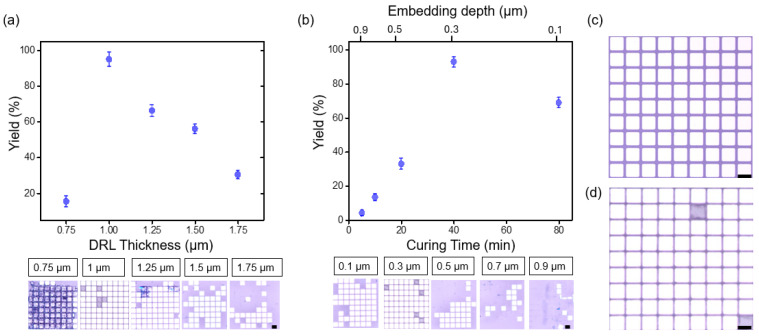
Figure 4.
Transfer yield as a function of (a) the DRL thickness and (b) the curing time, with the corresponding embedding depth indicated on the secondary X-axis above. The error bars in these graphs represent the standard deviations. OM images of (c) the donor substrate before transfer and (d) the receiver substrate after transfer with a 97% transfer yield. The black scale bar corresponds to 100 μm.

