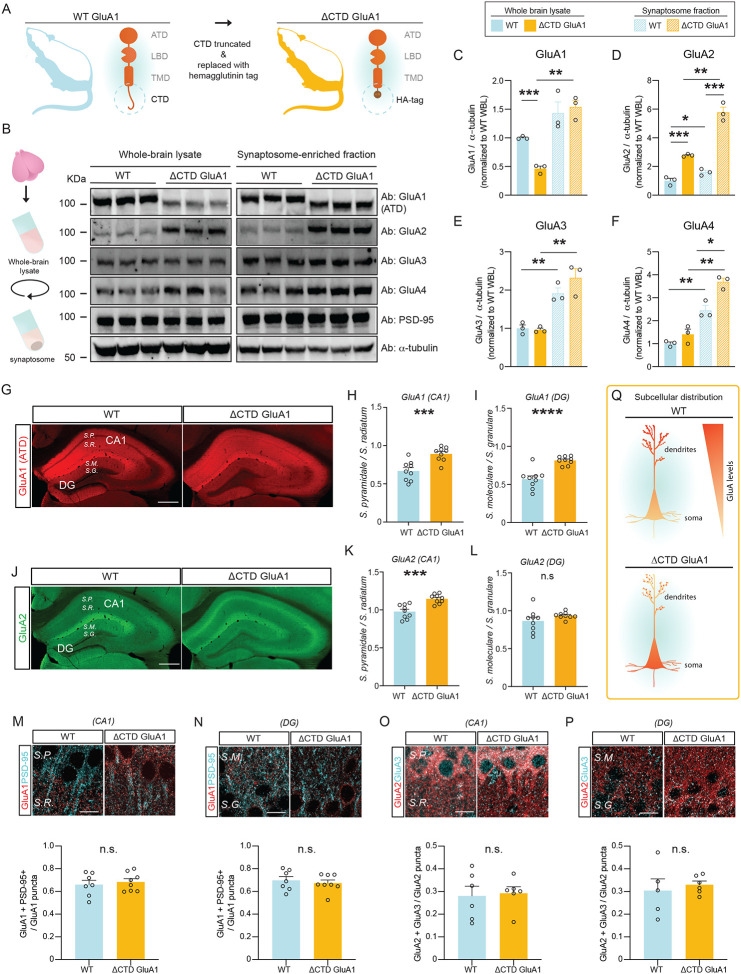
Figure 1. AMPAR subunit levels and subcellular distribution are affected by the loss of the GluA1 CTD.
A: Schematic depicting CTD truncation in ΔCTD GluA1 mice. B: Schematic of synaptosomal fractionation (left) and immunoblot from whole-brain lysate (WBL) and synaptosomal fractions of WT and ΔCTD GluA1 (right). C-F: GluA1 (C), GluA2 (D), GluA3 (E), and GluA4 (F) levels normalized to α-tubulin from WT WBL. G: GluA1 ATD staining (red) in WT and ΔCTD GluA1 hippocampus. H-I: Average soma / dendrite ratio of GluA1 signal in CA1 and DG, respectively. J: GluA2 staining (green) in WT and ΔCTD GluA1 hippocampus. K-L: Average soma/dendritic ratio of GluA2 in WT and ΔCTD GluA1 mice for hippocampal field CA1 and DG, respectively. M, N: Representative immunostaining of GluA1 (red) and PSD-95 (cyan) in CA1 and DG in WT and ΔCTD GluA1 samples (top) and colocalization quantification (bottom). O, P: Representative immunostaining of GluA2 (red) and GluA3 (cyan), in CA1 and DG in WT and ΔCTD GluA1 samples (top) and colocalization quantification (bottom). Q: Schematic of subcellular distribution of GluA1 and GluA2 in CA1 and DG in WT and ΔCTD GluA1 PNs. S.P., Stratum pyramidale; S.R., Stratum radiatum; S.M., Stratum moleculare; S.G., Stratum granulare. Scale bar: G, J, 200 μm; M-P, 10 μm. Error bars represent SEM. n.s., not statistically different; *, p≤0.05; **, p≤0.01; ***, p≤0.001; ****, p<0.0001. C-F: one-way ANOVA. H-P: unpaired t-test.

