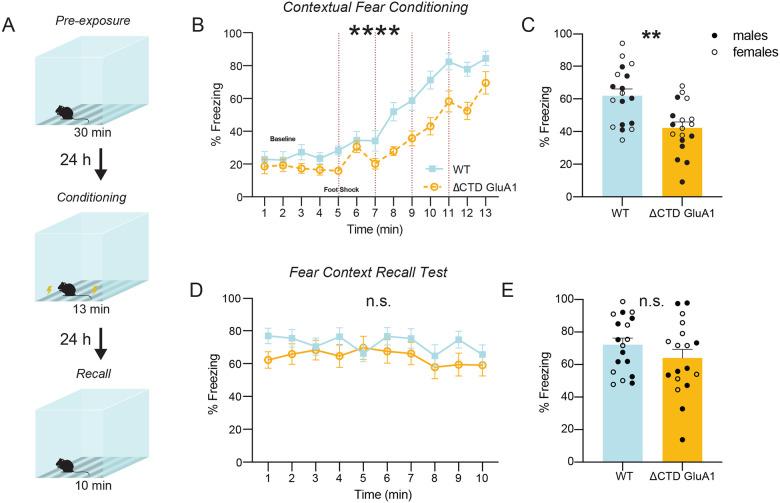
Figure 2. ΔCTD GluA1 mice exhibit novelty-induced hyperlocomotion and impaired fear expression, but intact memory.
A: Mean distance traveled during habituation phase for WT and ΔCTD GluA1 mice. B: Schematic of forced alternation Y-maze task. C: Time in novel arm relative to total time n novel and familiar arms for WT and ΔCTD GluA1 mice. D: Representative track plots overlayed atop heat maps of WT (left) and ΔCTD GluA1 (right) mice during habituation day 1 and 4. E: Mean distance traveled across time during habituation for WT and ΔCTD GluA1 mice. F: Schematic of object location memory (OLM) task (left) and representative heat maps (right) of WT and ΔCTD GluA1 mice during training and test day. G: Discrimination index during training and test sessions for WT and ΔCTD GluA1 mice in the OLM task. H: Schematic of novel object recognition (NOR) task (left) and representative heat maps (right) of WT and ΔCTD GluA1 mice during training and test day. I: Discrimination index during training and test sessions for WT and ΔCTD GluA1 mice in the NOR test. J: Schematic of contextual fear conditioning test. K, L: Freezing during training (K) and during the 24-hour contextual recall (L) during contextual fear conditioning for WT and ΔCTD GluA1 mice. Foot shocks are indicated with vertical red dashed lines. M, N: Freezing % across time (M) and average freezing % (N) during context recall test for WT and ΔCTD GluA1 mice. Error bars represent SEM. Empty dots represent females, filled dots represent males. n.s., not statistically different; *, p≤0.05; ***, p≤0.001; ****, p≤0.0001. A, E, K, M: two-way ANOVA. C: unpaired t-test. G, I: paired t-test. L: Mann-Whitney test. N: Welch’s t test.

