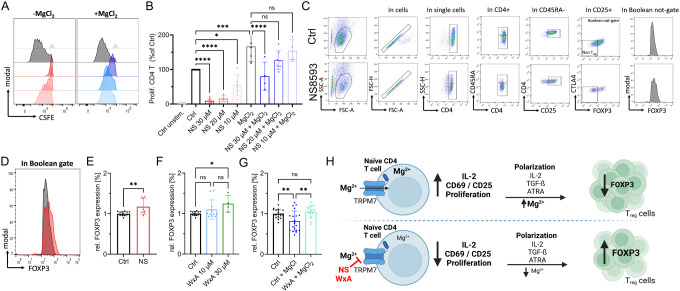
Figure 5: TRPM7-induced Mg2+ deficiency promotes human naïve CD4 T cell iTreg differentiation.
A) Representative histograms of dose-dependent proliferation (CSFE dye dilution) of conventional CD4 T cells in presence of various NS8593 concentrations, with (right) and without (left) supplementation with 6 mM MgCl2. Cells gated on T cell population, single cells and CD4 cells. Color code as in B. Cells gated on T cell population, single cells and CD4 T cells. B) Respective quantification of NS8593 dose dependent proliferation of conventional CD4 T cells, with and without supplementation with 6 mM MgCl2, corresponding to H, n=4-7. C) Representative FACS plots and gating path of iTreg cells after 6 days of differentiation of naïve CD4 T cells, cells treated with DMSO as solvent control (upper panel) or treated with 30 μM NS8593 (lower panel). D) Representative histogram overlay of FOXP3 signal in Boolean gate of DMSO controls (Ctrl, black) or in presence of 30 μM NS8593 (NS, red). E) Respective quantification of FOXP3 signal of cells treated with DMSO as solvent control (Ctrl, black) or 30 μM NS8593 (NS, red), n(Ctrl)=14; n(NS)=8. F) Respective quantification of FOXP3 signal of cells treated with EtOH as solvent control (Ctrl, black), 10 μM waixenicin A (WxA, blue) or 10 μM waixenicin A (WxA, green), n(Ctrl)=14; n(10 μM WxA)=11; n(30 μM WxA)=4. G) Respective quantification of FOXP3 signal of EtOH controls (Ctrl, black), DMSO Ctrl + 6 mM MgCl2 (Ctrl+MgCl2, blue), 30 μM waixenicin A + MgCl2 (WxA+MgCl2, turquoise), n(Ctrl)=20; n(Ctrl+MgCl2)=20; n(30 μM WxA + MgCl2)=12. H) Graphical summary of TRPM7-independent iTreg differentiation. Pharmacological blockade of TRPM7 reduces intracellular Mg2+ levels and results in reduced IL-2 secretion, impaired upregulation of T-cell activation markers CD69 and CD25 and diminished proliferation in presence of TCR stimulus. TRPM7 inhibition followed by polarization of naïve CD4 T cells in presence of anti-CD3/CD28, IL-2, TGF-ß and ATRA, an iTreg polarization cocktail, results in lower iTreg numbers but enhanced FOXP3 expression. Figure created in https://BioRender.com. Statistics: One-way ANOVA (B, F, G) and Student´s t test (E). * P<0.05; ** P<0.005; *** P<0.0005; **** P<0.0001 and n.s.—not significant. Data are mean ± SD.

