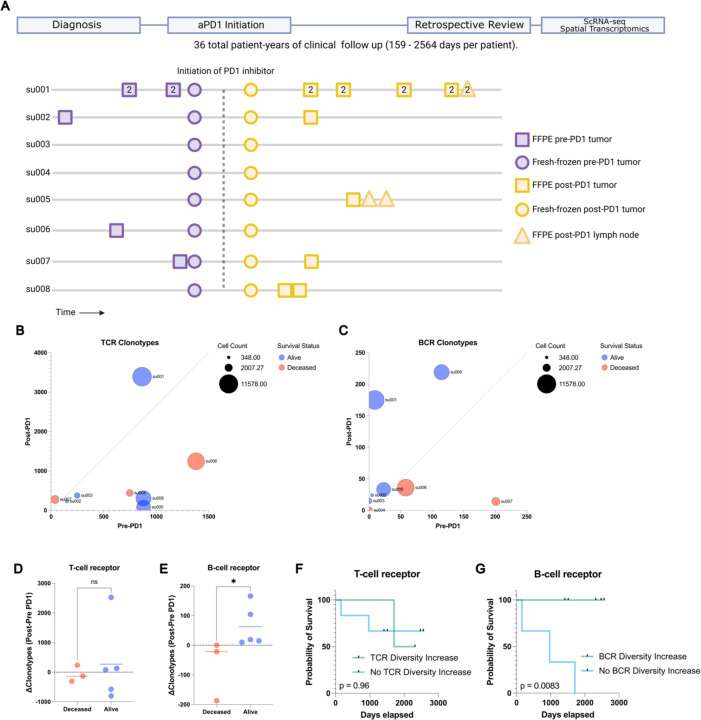
Figure 1: Long term survival of advanced BCC patients highlights prognostic role of aPD1- induced BCR clonal diversity.
A) A schematic diagram of our BCC patient cohort. Top: A retrospective chart review was performed after an extended period of clinical follow up lasting up to 2564 days to allow final clinical outcomes of PD-1 blockade to manifest. Bottom: A visualization of the samples taken for our prior study (Yost et al. 2019) and this study. All patients had pre- and post-PD-1 inhibitor-treated tumor samples for scRNA-seq (circles). All availablearchived specimens in long-term storage were accessed (squares and triangles) and processed for spatial transcriptomics. Numbers within the shapes represent replicates taken from sequential sections of the sample tissue block. Y axis represents anonymized patient identifiers while the x-axis represents time (not to exact scale).
B) Unique TCR and C) BCR clonotype counts detected per patient in their pre-PD-1 inhibitor tumor (X-axis) and post-PD-1 inhibitor treated tumor (Y axis) as calculated by TRUST4 run on 5' single cell RNA sequencing as described (Methods). Point sizes represent the total cell count obtained from tumors of each patient.
D) Change in unique TCR and E) BCR clonotype counts between pre-PD-1 inhibitor and post-PD-1 inhibitor tumors for each patient (Y-axis), stratified by clinical status at last available follow up.
F) Kaplan-Meier curve of overall survival for our BCC patient cohort stratified by the change in pre-to-post PD-1 inhibitor TCR and G) BCR clonotype count. P-values calculated using the log-rank test.

