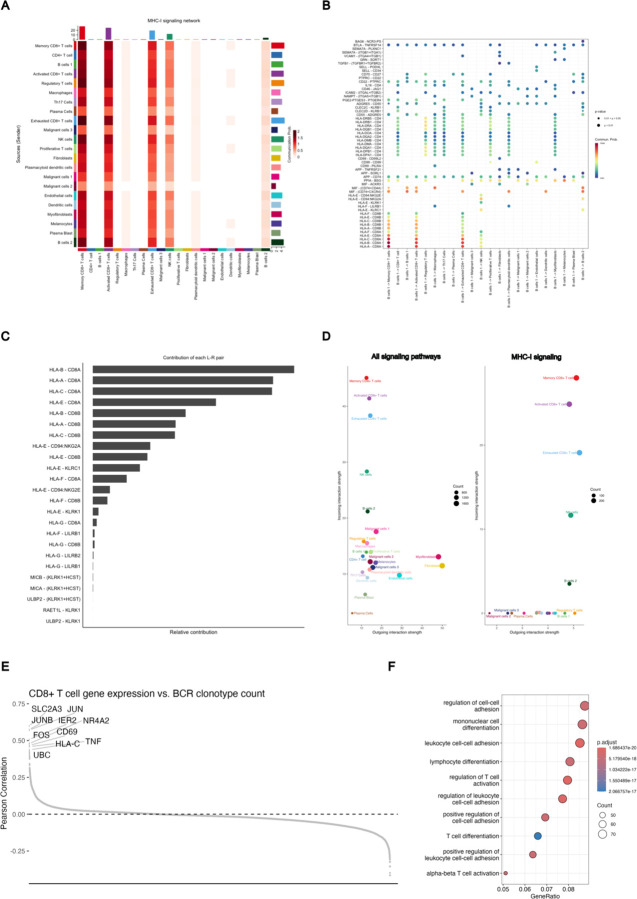
Extended Data Figure 6: CellChat Analysis of B-CeIl/T-Cell Signaling.
A) Heatmap of communication probabilities in MHC-I signaling pathways between cell clusters.
B) Significant communication pathways originating from cluster B cell 1 representative of B outgoing B cell signaling.
C) Relative contribution of each ligand-receptor pair to MHC-I signaling strength between B cell clusters and Activated CD8+ T cells.
D) Outgoing and incoming signaling strength per cell cluster for all signaling pathways (left) and MHC-I signaling pathways (right) calculated using CellchatDB.
E) Pearson correlation between gene expression in CD8+ T cells vs. the BCR clonotype count in the respective tissue sample. Each point is the correlation of a single gene, and the plot it ordered from most positive correlation to most negative correlation.
F) GO-Terms enriched in genes significantly correlated with BCR clonotype count in CD8+ T cells (defined as adjusted p-value <0.05).

