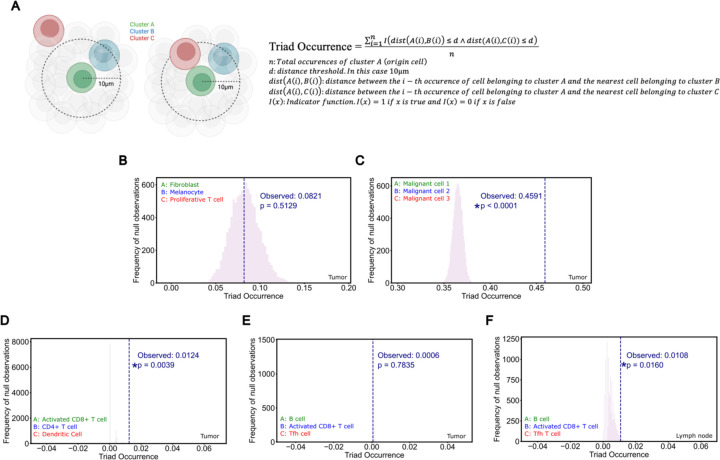
Extended Data Figure 7: Immune Triads Involving B cells and Activated T cells.
A) Schematic and equation of spatial cell triad calculation. The Triad Occurrence is defined as the proportion of existing co-localized pairs of two cell types (Cluster A and B) that also have a proximal third cell type interaction (Cluster C).
B) Fibroblast/Melanocyte/Proliferative T cell Triad Occurrence; negative control in aPD1-treated tumors.
C) Malignant cell 1/Malignant cell 2/Malignant cell 3 Triad Occurrence; positive control in aPD1-treated tumors.
D) Activated CD8+ T cell/CD4+ T cell/Dendritic cell Triad Occurrence in aPD1-treated tumors.
E) B cell/Activated CD8+ T cell/Tfh Triad Occurrence in aPD1-treated tumors.
F) B cell/Activated CD8+ T cell/Tfh Triad Occurrence in aPD1-treated draining lymph nodes.

