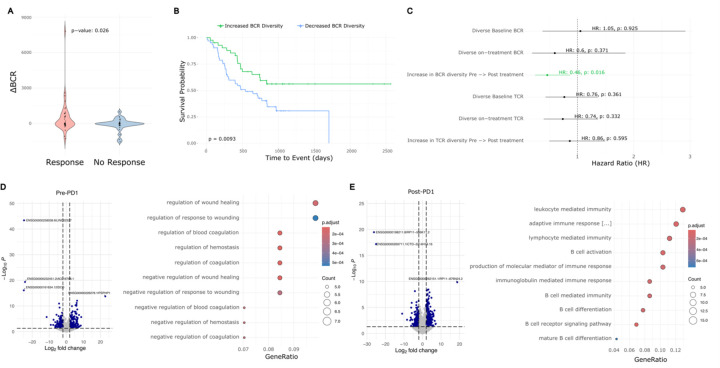
Figure 4: Meta-analysis of BCC, glioblastoma, melanoma, and HNSCC reveals a general prognostic role for aPD1-induced BCR diversity.
A) ∆BCR clonotype count from pre-PD1 inhibitor to post-PD1-inhibitor of patients with progressed tumors vs. non-progressed tumors.
B) Kaplan-Meier curve of overall survival for aggregate cancer patients stratified by induced BCR expansion from PD-1 inhibitor.
C) Hazard ratios of overall survival for aggregate cancer patients by BCR or TCR clonotype. An increased clonotype diversity is defined by a greater number of clonotypes detected in post-PD1 treated tumors compared to prior. Diversity in the case of static measurements at baseline or on-treatment are defined as an above-median BCR or TCR clonotype count.
D) Left: Volcano plot of differentially expressed genes in pre-treatment tumors that undergo induced BCR expansion vs. those without. Right: GO-terms enriched in pre-treatment tumors that undergo induced BCR expansion vs. those without.
E) Left: Volcano plot of differentially expressed genes in post-treatment tumors that undergo induced BCR expansion vs. those without. Right: GO-terms enriched in post-treatment tumors that undergo induced BCR expansion vs. those without

