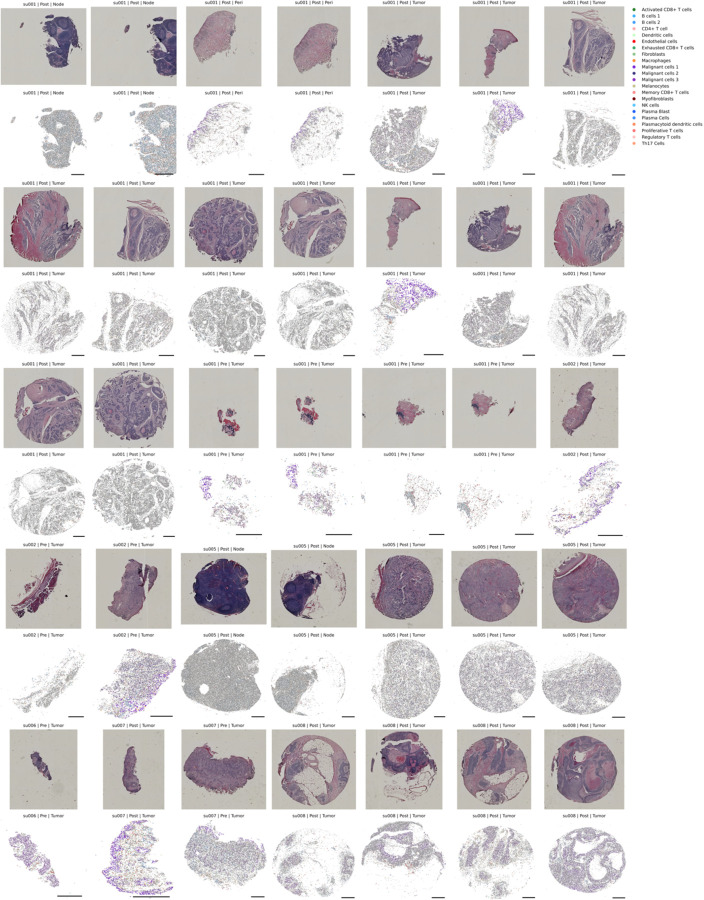
Extended Data Figure 3: H&E and Xenium In-situ of Primary Patient Specimens.
Patient tissue specimens sent for Xenium in situ analysis. Top panels represent H&E staining of the identical tissue section run for Xenium. Bottom panels are spatial cell boundaries (grey) colored by cell type predictions generated through the previously described nearest neighbor approach in the ENVI latent space. Scale bars are 0.5mm. Xenium cells are downsampled to 40% for visualization.

