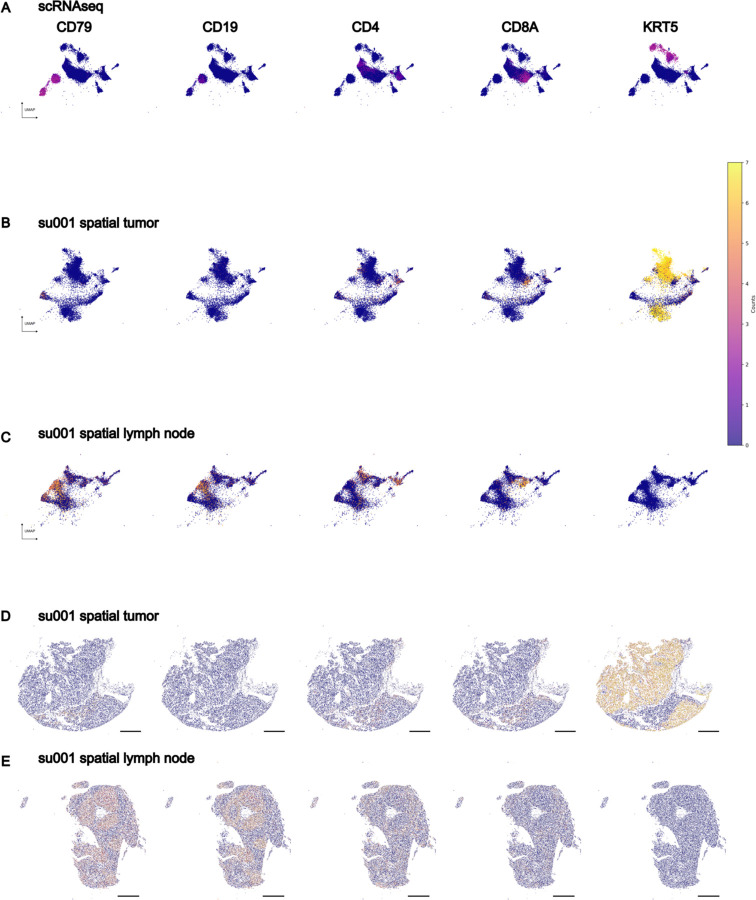
Extended Data Figure 4: ENVI Latent Space and Spatial Representation of Example Tumor and Lymph Node.
A) UMAPs of scRNA-seq cells B) Xenium tumor sample cells and C) Xenium draining lymph node cells colored by expression of select cell type markers in the shared ENVI latent embeddings.
D) Spatial plots of the sample shown in B.
E) Spatial plots of the sample shown in C. Scale bars are 0.5mm.

