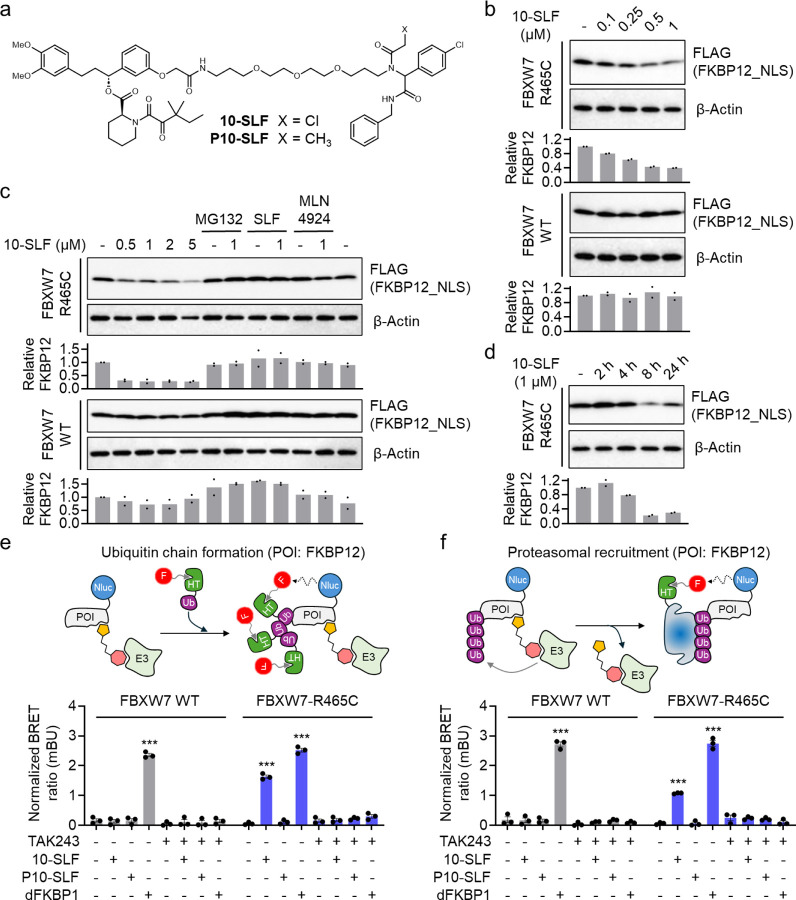
Figure 2. FBXW7-R465C supports 10-SLF-induced ubiquitination and degradation of FKBP12.
a. Structures of 10-SLF and P10-SLF. b. Dose-dependent degradation of FKBP12_NLS by 10-SLF. HEK293T cells expressing HA-FBXW7 WT or R465C and FLAG-FKBP12_NLS were treated with 0.1–1 μM 10-SLF for 8 hours. The bar graph represents quantification of the FKBP12/β-Actin protein content. Data are presented as the mean values (n = 2 independent replicates). c. 10-SLF-induced FKBP12_NLS degradation was blocked by MG132, SLF, and MLN4924. The bar graph represents quantification of the FKBP12/β-Actin protein content. Data are presented as the mean values (n = 2 independent replicates). d. A time-course study of 10-SLF-induced FKBP12_NLS degradation. The bar graph represents quantification of the FKBP12/β-Actin protein content. Data are presented as the mean values (n = 2 independent replicates). e. NanoBRET assay measuring the ubiquitination of FKBP12 induced by 10-SLF. Data are presented as the mean values ± s.e.m. (n = 3 independent replicates). The statistical significance was evaluated through unpaired two-tailed Student’s t-tests, comparing cells treated with 10-SLF or dFKBP1 to DMSO. ***P < 0.001. f. NanoBRET assay measuring the engagement of FKBP12 with the proteasomal submit PSMD3 induced by 10-SLF. Data are presented as the mean values ± s.e.m. (n = 3 independent replicates). The statistical significance was evaluated through unpaired two-tailed Student’s t-tests, comparing cells treated with 10-SLF or dFKBP1 to DMSO. ***P < 0.001.

