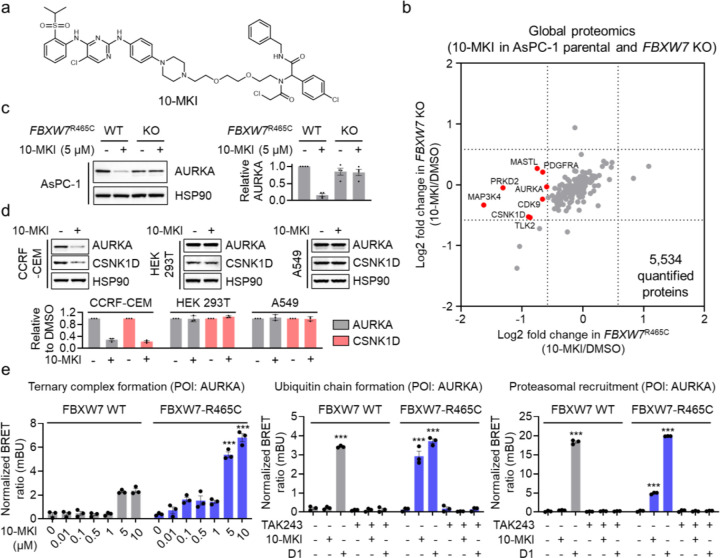
Figure 5. Utilizing FBXW7-R465C for the degradation of additional protein targets.
a. Structure of 10-MKI. b. Global proteomic analysis in AsPC-1 parental and FBXW7R465C KO cells treated with 5 μM 10-MKI for 24 hours. Data are presented as the mean values (n = 2 independent replicates for DMSO treatment, n = 3 independent replicates for 10-MKI treatment). c. Treatment with 10-MKI (5 μM, 24 hours) induced AURKA degradation in AsPC-1 parental cells but not in FBXW7R465C KO cells. The bar graph represents quantification of the AURKA/HSP90 protein content. Data are presented as the mean values ± s.e.m. (n = 3 independent replicates). d. 10-MKI induced the degradation of AURKA and CSNK1D in CCRF-CEM cells, but not in HEK293T or A549 cells. The bar graph represents quantification of the AURKA/HSP90 protein content. Data are presented as the mean values ± s.e.m. (n = 3 independent replicates). e. NanoBRET assays demonstrated that 10-MKI induced ternary complex formation between FBXW7-R465C and AURKA, along with the ubiquitination and proteasomal engagement of AURKA. Data are presented as the mean values ± s.e.m. (n = 3 independent replicates). The statistical significance was evaluated through unpaired two-tailed Student’s t-tests, comparing cells treated with 10-MKI or D1 to DMSO. ***P < 0.001.

