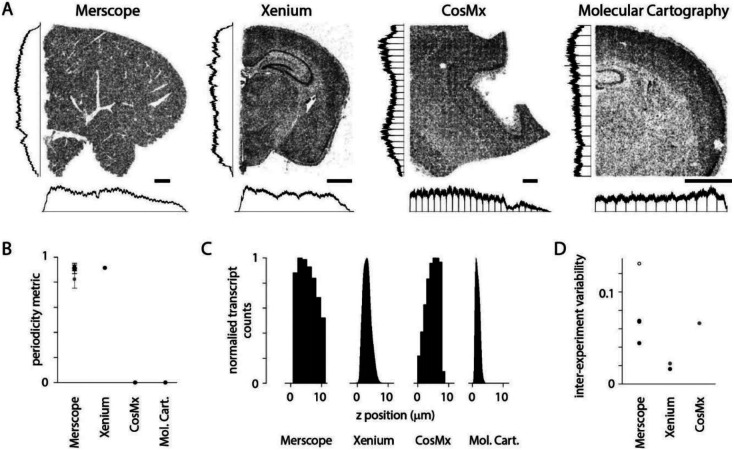
Figure 8.
Transcript density across spatial transcriptomics platforms. (A) Example sections from four commercial platforms. MERSCOPE, mouse liver section. CosMx, human brain. Xenium and Molecular Cartography, mouse brain. Scale bars, 1 mm. Histograms indicate transcript density in (cardinal axes, normalized to peak). (B) Periodicity metric for public datasets (4 sections in A and 3 Vizgen mouse brain datasets). Grey: mean ± stdev periodicity metric for the Yao et al. (2023) Allen Brain Cell Atlas dataset. (C) Transcript count along the z axis for sections in A. (D) Pairwise CV of transcripts across experiments. MERSCOPE, 3 Vizgen mouse brain datasets and Yao et al. (2023) Allen Brain Cell Atlas dataset (open symbol). Xenium, fresh-frozen-mouse-brain-replicates-1-standard dataset from 10x. Grey datapoints (Xenium and CosMx) from Cook et al. (2023).

