Figure.
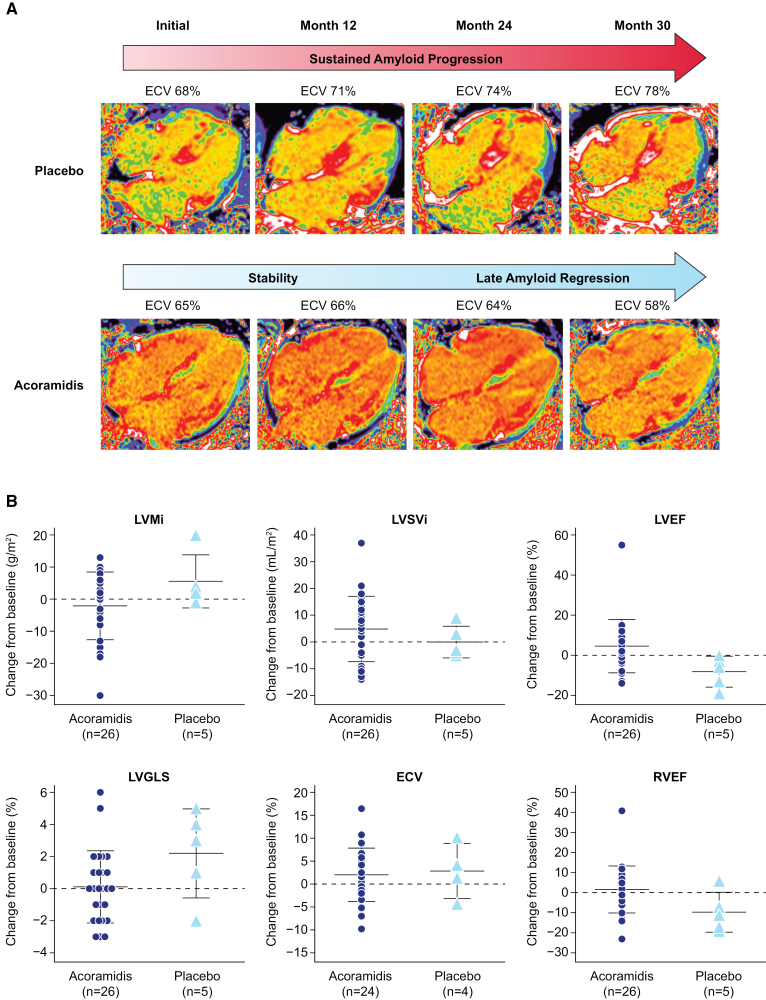
Change in extracellular volume (ECV) and cardiac magnetic resonance (CMR) parameters over time. A, Illustrative examples of 2 participants within the CMR substudy. Top, Serial 4-chamber ECV maps from a participant who received a placebo. Sustained amyloid progression and increase in cardiac amyloid burden consistent with the natural history of transthyretin amyloid cardiomyopathy are seen in the placebo participant, with ECV rising from 68% at initial CMR to 78% at month 30 (M30). Bottom, A participant receiving acoramidis who initially demonstrated stable cardiac amyloid burden, followed by late amyloid regression at M30 with an observed reduction of ECV from 65% at initial CMR to 58% at M30. B, Scatter plots represent a change from baseline at M30 for selected CMR parameters (indexed left ventricular mass [LVMi], indexed left ventricular stroke volume [LVSVi], left ventricular ejection fraction [LVEF], left ventricular global longitudinal strain [LVGLS], ECV, and right ventricular ejection fraction [RVEF]) for each participant. Each symbol represents data for individual participants, and horizontal bars represent the mean and SD for acoramidis and placebo groups. Favorable trends were noted across parameters in participants receiving acoramidis (n=26 for all parameters other than ECV; n=24 for ECV) relative to their placebo counterparts (n=5 for all parameters other than ECV; n=4 for ECV). CMR scans were acquired on a 1.5T scanner (MAGNETOM Aera, Siemens Healthcare, Germany) using a standardized protocol comprising cine imaging with steady-state-free-precession sequence and late gadolinium enhancement imaging. Native T1 measurement (comprising 3 short axes and a 4-chamber map) was performed with the modified look-locker inversion (MOLLI) recovery sequence. Fifteen minutes following the administration of a 0.1-mmol/kg gadolinium meglumine bolus (Dotarem, Guebet, France), T1 mapping was acquired using the same slice locations with the MOLLI sequence, and inline ECV maps were automatically generated using hematocrit. Image analysis was performed blinded to other trial data. ECV values were measured by drawing a region of interest in the basal-mid septum on 4-chamber maps. Myocardial contraction fraction (%) was calculated based on Shimada et al,4 as (left ventricular end-diastolic volume−left ventricular end-systolic volume)/left ventricular myocardial volume×100.4 ECV maps are acquired by isolating a signal to the myocardial extracellular space by using the precontrast and postcontrast T1 maps in conjunction with the serum hematocrit; due to varying serum hematocrit values between patients, the myocardial blood pool may appear visually different between patients with similar myocardial ECV values. CMR image quality and volumetric data may be impacted by several factors, including, but not limited to, arrhythmia, breathing artifacts, and unintentional patient movement.

