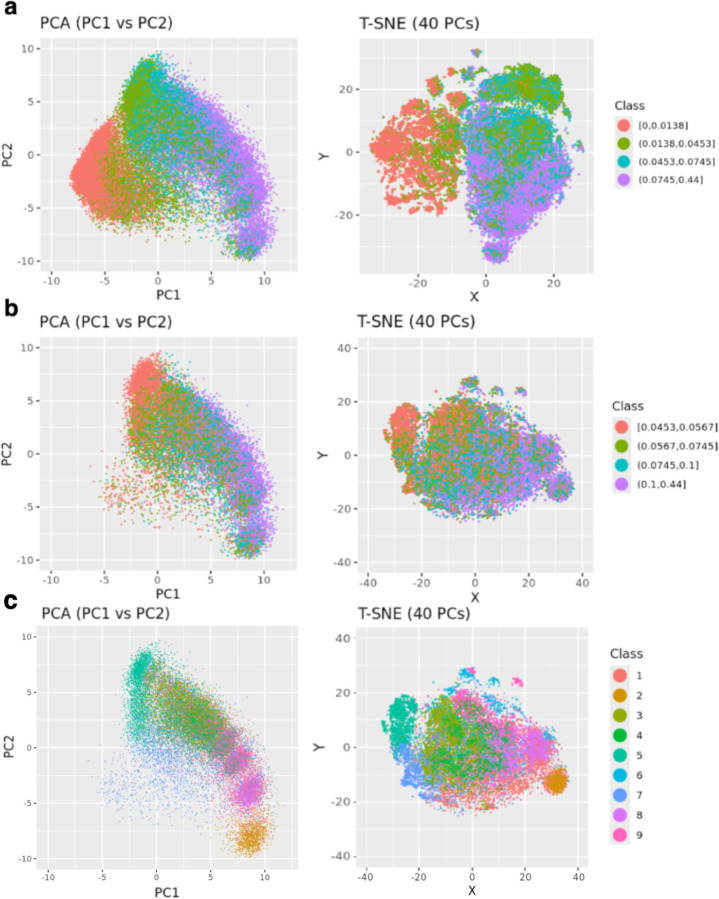
Figure 4.
GRU-D-AE-based clustering of case pre-AOM periods. a) Coloring all pre-AOM periods according to data quality quartiles. b) Low-quality data points (below the median) are removed, with the remaining points colored by data quality quartiles. c) Colored by GMM-based clustering of the high quality data points (PCA plot was dimmed to highlight cluster center).

