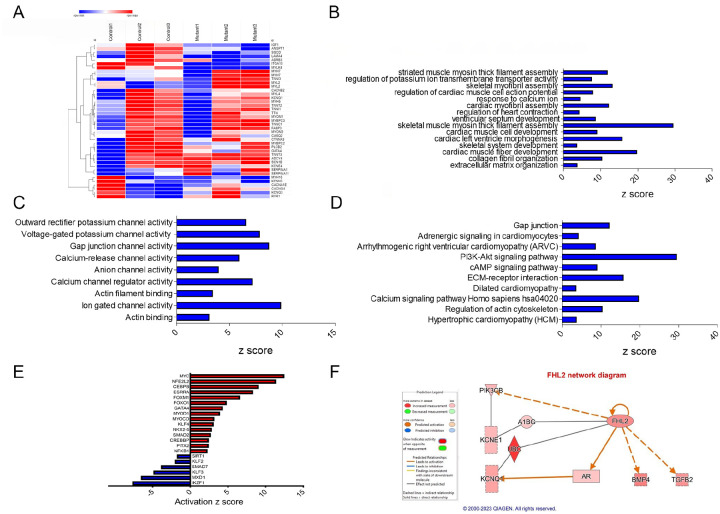
Figure 4: Transcriptomic profile and pathway enrichment analysis comparing TTN-T32756I iPSC-aCMs with the WT.
(A) Heatmaps of cardiac-related upregulated and downregulated differentially expressed genes (DEGs) (B) Top significantly enriched downregulated cardiac-related Gene-Ontology Biological process (GO-BP) pathways in the TTN-T32756I iPSC-aCMs. (C) Top significantly enriched downregulated cardiac-related Gene-Ontology Molecular Function (GO-MF) pathways in the TTN-T32756I iPSC-aCMs. (D) Top significantly enriched downregulated cardiac-related Kyoto Encyclopedia of Genes and Genomes (KEGG) pathways in the TTN-T32756I iPSC-aCMs.(E) Significantly enriched upregulated and downregulated transcription factors (TFs) (F) Network diagram showing the upregulation of KCNQ1 by FHL2 predicted by the Ingenuity pathway enrichment analysis (IPA).

