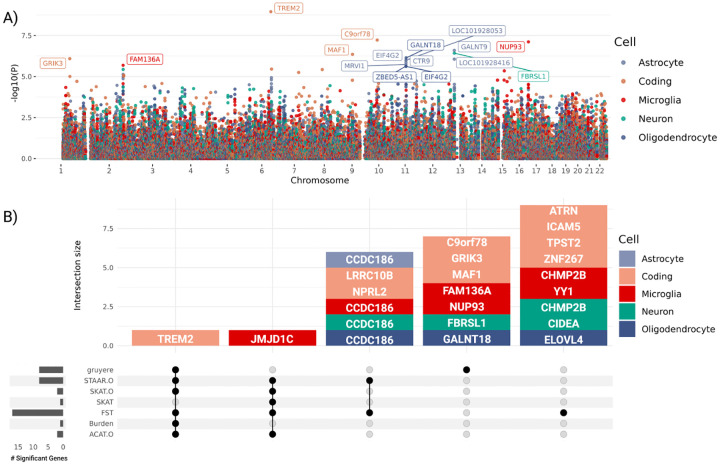
Fig. 6. Top gruyere genes.
A) Manhattan plot across cell types. The -axis shows -value) for each gene and -axis shows gene position. Each color is a cell type. gruyere-significant genes are labeled. B) Stacked upset plot of significant gene overlap across all tests after pruning for coregulation. Dark grey bars on left indicate total number of significant genes for each test. Vertically connected dots represent groups and corresponding bars indicate the number of overlapping significant genes identified for that group. Each bar is colored by cell type.

