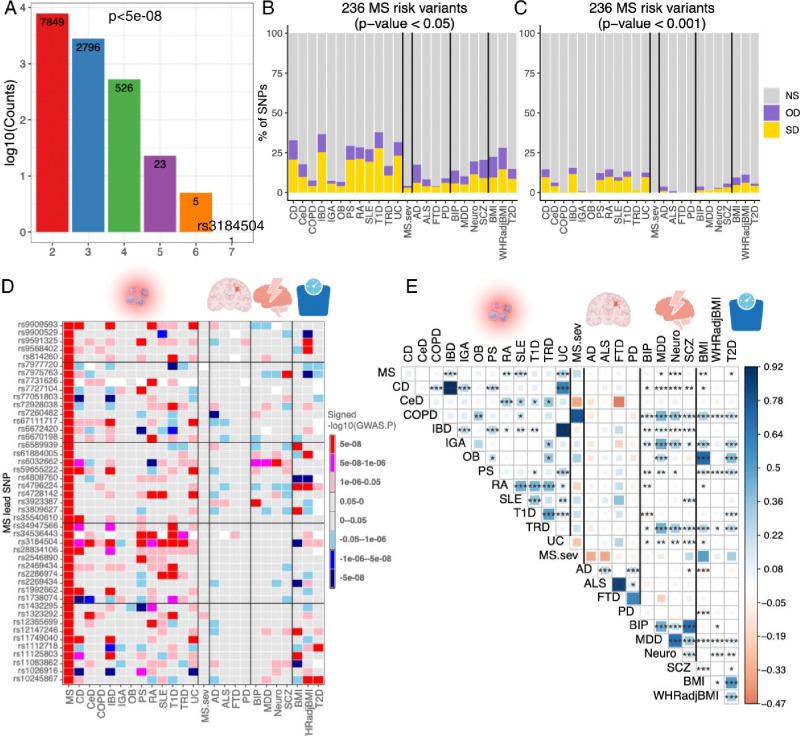
Fig. 3. Overlap of the genetic architecture of multiple sclerosis with other diseases/traits.
(A) The number of SNPs that reached genome-wide significant (P < 5 × 10⁻⁸) and were shared across 12 autoimmune diseases.
(B, C) Percentage of non-major histocompatibility complex SNPs of MS severity, 12 inflammatory/4 neurodegenerative/4 psychiatric/3 BMI-associated diseases/disorders/traits that are not statistically significant (NS), or significant in the same direction (SD) or the opposite direction (OD) in the current 236 MS risk variants using two P-values cut-off (p<0.05 and 0.001). Cell types are ordered alphabetically from left to right.
(D) The comparison of 45 MS risk variants with other 24 diseases/traits, the colors represent effect directions and p values. White color denotes SNPs that were not detected in the corresponding phenotypes.
(E) Genetic correlation estimated across MS and other 24 diseases/traits. The areas of the squares represent the absolute value of corresponding genetic correlations. After FDR correction for 325 tests at a 5% significance level, genetic correlation estimates that are significantly different from 0 are marked with an asterisk (*.01 < pFDR < .05; **.001 < pFDR < .01; ***pFDR < .001). The blue color denotes a positive genetic correlation, and the red color represents a negative genetic correlation.

