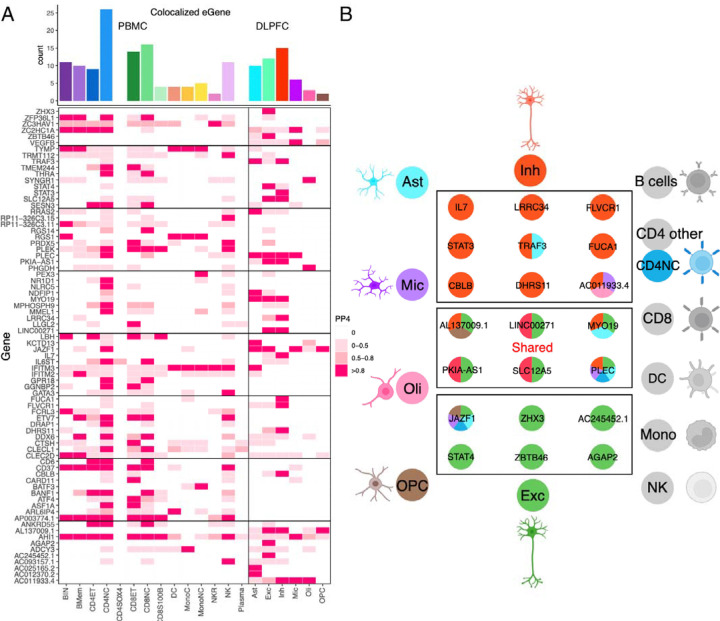
Fig 5. Overlap of the results from PBMC/DLPFC eQTL and GWAS of MS.
(A) Heatmap reports the PP.H4 of the Coloc method, which assumes that GWAS and eQTLs share a single causal SNP. The rows report the overlap for individual gene and SNP pairs; the columns report the PP.H4 score in each of our cell types. The color of each square is based on the code found to the right; the darker color denotes higher confidence that the same variant influences susceptibility and gene expression in that cell type. The top bar chart shows the number of colocalized eGenes with high confidence (PP.H4 > 0.8) in each cell type.
(B) Cartoon illustration summarizes the colocalization effects of neurons compared to the 18 cell types included in our analysis, colored by cell type.

