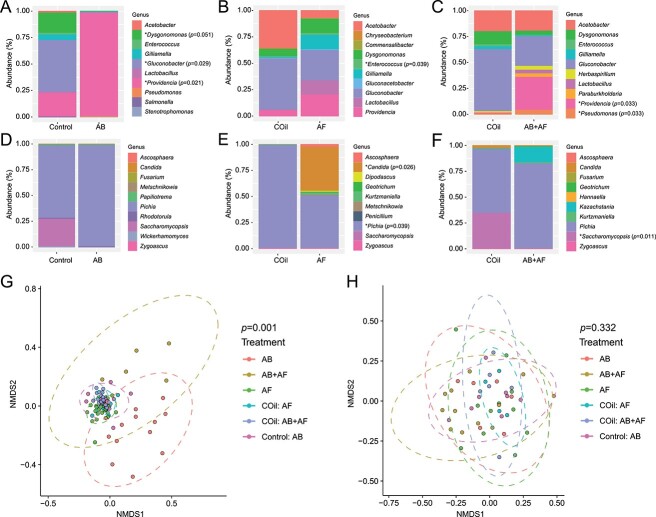
Figure 2.
Microbiome profiles of control and experimental flies. A–C. Scaled relative abundance plots for the 10 most abundant bacterial genera following antibacterial (AB), antifungal (AF) or antibacterial and antifungal (AB+AF) treatment and the respective controls (Control or COil). Each column represents the average of 6–8 individuals based on high throughput 16S rRNA gene amplicon sequencing. The p-values were determined using univariate multiple testing with an F test; *: Relative abundance is significantly different between control and treatment conditions. D–F. Scaled relative abundance plots for the 10 most abundant fungal genera following AB, AF, or AB+AF treatment or the respective controls (con or COil). Each column represents the average of 6–8 individuals based on high throughput ITS gene amplicon sequencing. The p-values were determined using univariate multiple testing with an F test; *: Relative abundance is significantly different between control and treatment conditions. G. Non-multidimensional scaling plots (NMDS) based on Jaccard distances of bacterial OTUs (grouped at 97% similarity level) from control and experimental treatments. Ellipses represent significance at 0.05 confidence. H. Non-multidimensional scaling plots (NMDS) based on Jaccard distances of fungal OTUs (grouped at 97% similarity level) from control and experimental treatments. Ellipses represent significance at 0.05 confidence.

