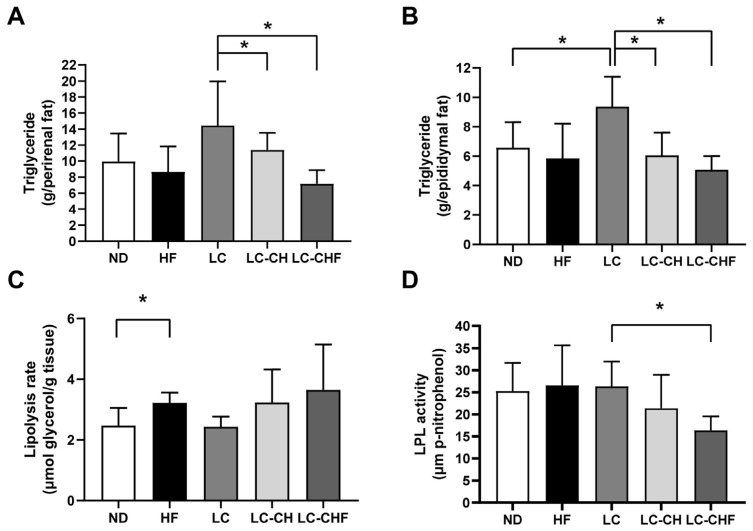
Figure 4.
The results of (A) perirenal and (B) epididymal adipose tissue triglyceride concentration, and the change in (C) perirenal adipose tissue lipolysis rate and (D) lipoprotein lipase (LPL) activity in rats fed with the different experimental diets after 15 weeks. Results are expressed as the mean ± SD for each group (n = 7). The significant difference (p < 0.05) was analyzed by one-way ANOVA. * p ˂ 0.05 as compared between two indicated groups. ND: normal control diet; HF: high-fat diet; LC: low-carbohydrate + high-fat diet; LC-CH: low-carbohydrate + high-fat diet + 5% chitosan; and LC-CHF: low-carbohydrate + high-fat diet + 5% chitosan + 5% fish oil.

