Figure 9.
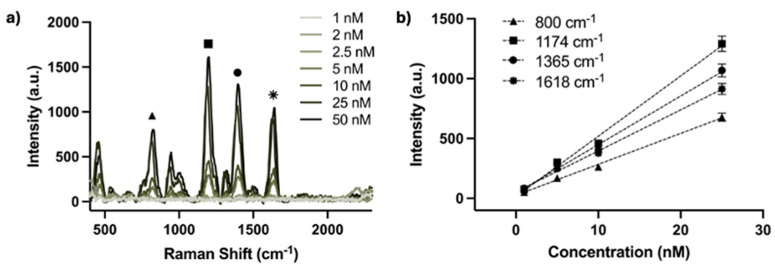
(a) SERS spectra of various MGITC concentrations in AgNP solution acquired by the waveguide device, where the characteristic Raman peaks are labeled. (b) SERS intensities of the characteristic spectral features versus the concentration of MGITC in AgNPs solution, each shown over the portion of concentration regime with linear response.

