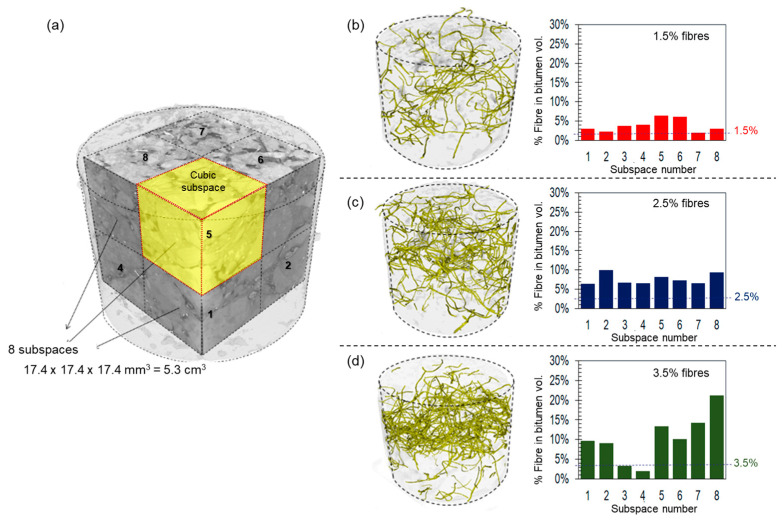
Figure 9.
(a) On the left side, a view of the cubic sub-spaces used to quantify the spatial distribution of fibres into the asphalt mixture samples. On the right, the 3D CT-Scan of the spatial fibre distribution and a chart with the percentage of fibres in the bitumen volume for each subspace. For asphalt specimens containing (b) 1.5%, (c) 2.5%, and (d) 3.5% fibres (modified from González et al. [1]).

