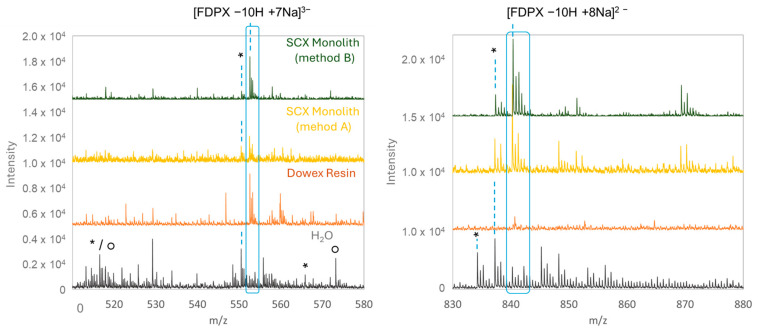
Figure 1.
Mass spectra of a Fondaparinux solution (50 µM) obtained by nano-ESI-TOF during the infusion of solution at 0.4 µL/min with additional liquid methanol at 0.4 µL/min after elution from a monolithic exchange column of cations prepared from sodium mercaptoethane sulfonate (L = 8.5 cm, di = 75 µm), sodium bisulfite, or pretreated on DowexTM resin. The spectra were obtained in negative polarity, at a source voltage of 1.4 kV and a fragmentor voltage of 300 V. The asterisks represent the Na/K exchanges, and the circles represent the sulfate losses.

