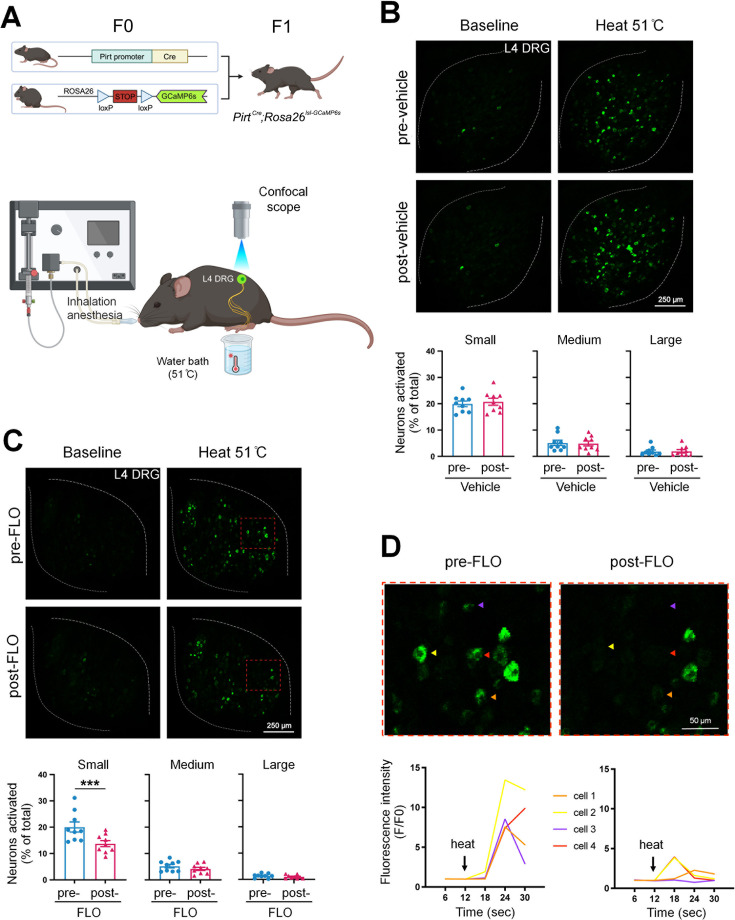
Figure 2. FLO acutely attenuated the responses of small dorsal root ganglion (DRG) neurons to noxious heat stimulation.
(A) Upper: Strategy for generating PirtCre;Rosa26lsl-GCaMP6s mice. Lower: The schematic diagram illustrates the experimental setup for in vivo optical imaging of L4 DRG neurons and applying test stimulation. (B, C) Upper: Representative images of calcium transients in DRG neurons in response to noxious heat stimulation (51°C water bath) applied to the hind paw before and 1 hr after an intra-paw injection of vehicle (B, saline) or FLO (C, 0.5 mg, 20 μl) at Day 2 after plantar-incision. Lower: Percentages of small-, medium-, and large-size neurons that were activated (ΔF/F ≥ 30%) by heat stimulation before and after vehicle or FLO. ‘% of total’ represented the proportion of activated neurons relative to the total number of neurons counted from the same analyzed image. DRG neurons were categorized according to somal size as <450 μm2 (small), 450–700 μm2 (medium), and >700 μm2 (large). N = 9/group. (D) The higher-magnification representative images (upper) and calcium transient traces (lower) show increased fluorescence intensities in four DRG neurons (indicated by colored arrows) responding to heat stimulation, and decreased responses after FLO treatment. Data are mean ± SEM. (B, C) Paired t-test. ***p < 0.001 versus pre-drug.

