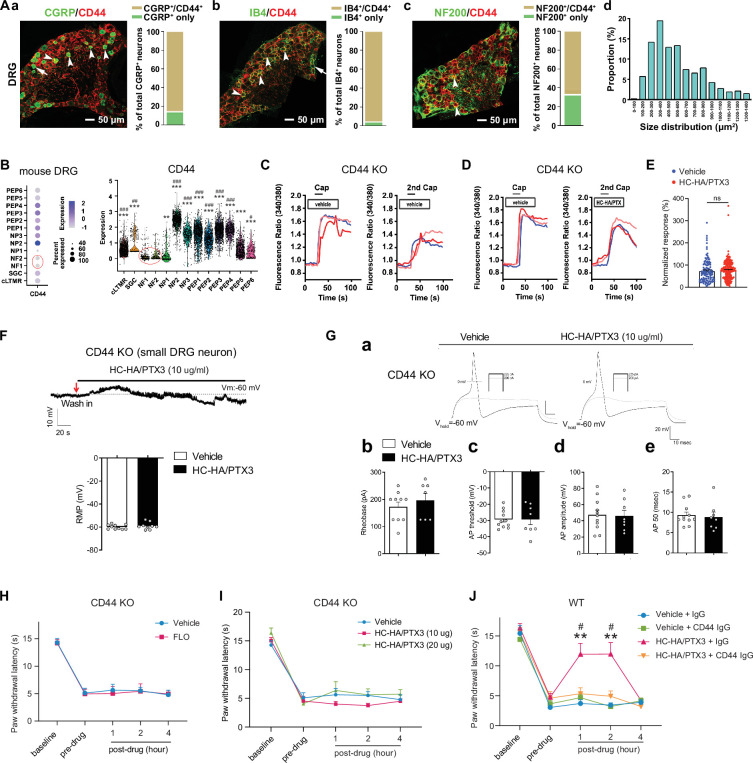
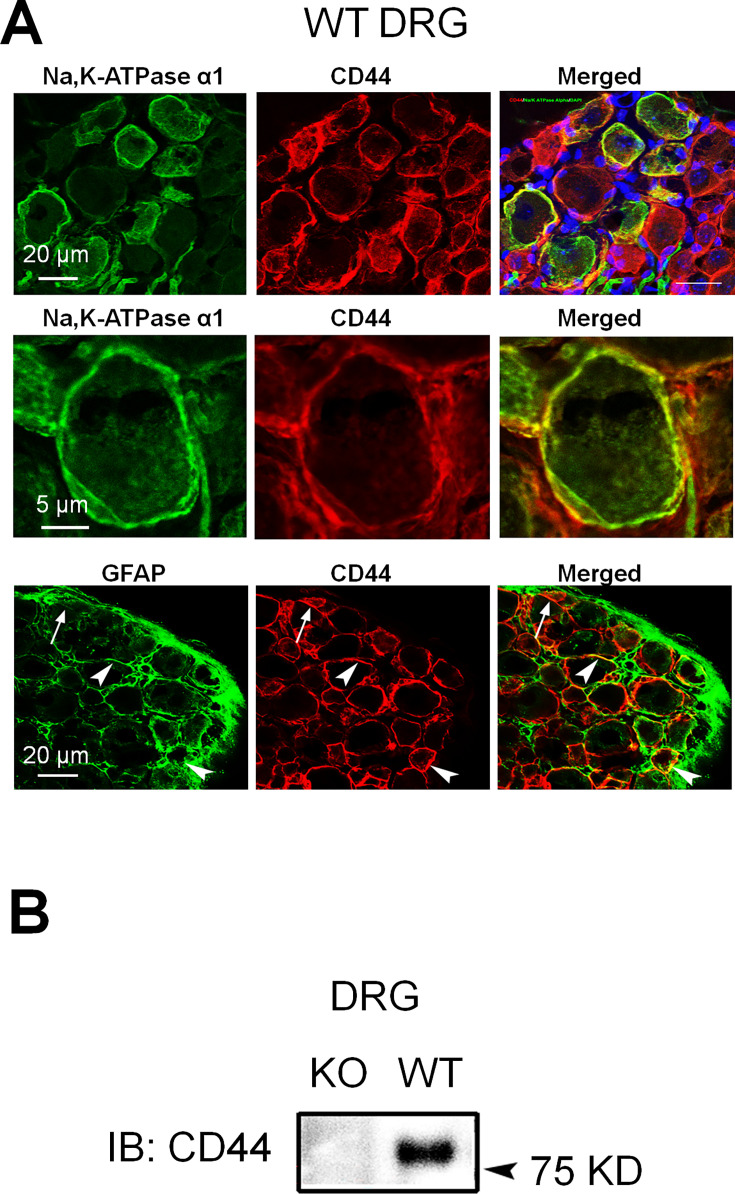
Figure 4. FLO and heavy chain-hyaluronic acid/pentraxin 3 (HC-HA/PTX3) inhibited pain via CD44-dependent mechanisms.
(A) The expression of CD44 in the dorsal root ganglion (DRG) of wild-type (WT) mice. Left: Colocalization of CD44 and CGRP (a), IB4 (b), and NF200 (c) immunoreactivity (IR). Right: The quantification of CD44-expressing neurons (as % of total neurons in each subpopulation, IB4+: 96%; CGRP+: 82%; NF200+: 68%, N = 4). (d) The size distribution of CD44-expressing neurons. (B) Left: Dot plot of CD44 gene expression in different clusters [SGC (1), NF (2), NP (3), PEP (6), cLTMR (1)] of DRG cells from WT mice in single-cell RNA-sequencing study. The dot size represents the percentage of cells expressing CD44, and the color scale indicates the average normalized expression level. The NF1 and NF2 clusters were indicated with a red circle. Right: Violin plot shows the CD44 expression levels in each cluster. SGC: satellite glial cells; NF, Aβ or Aδ low-threshold mechanoreceptors or proprioceptors; NP, non-peptidergic nociceptors or pruriceptors; PEP, peptidergic nociceptors; C-LTMR, C-fiber low-threshold mechanoreceptors. One-way analysis of variance (ANOVA) followed by Bonferroni post hoc test. **p < 0.01, ***p < 0.001 versus NF1; #p < 0.05, ##p < 0.01, ###p < 0.001 versus NF2. (C) Traces show that the capsaicin (0.3 μM) evoked an increase of [Ca2+]i in a small neuron from a CD44 KO mouse. Compared to [Ca2+]i rising evoked by the first capsaicin application, there was a reduction of [Ca2+]i rising to the second treatment, indicating TRPV1 desensitization. DRG neurons were categorized according to cell body diameter as <20 μm (small), 20–30 μm (medium), and >30 μm (large). (D) Capsaicin-evoked increases of [Ca2+]i before and after treatment (20 min) with HC-HA/PTX3 (10 μg/ml) in small DRG neurons from CD44 KO mice.(E) The quantification of evoked [Ca2+]i rising by capsaicin. HC-HA/PTX3 pretreatment did not reduce capsaicin-evoked [Ca2+]i rising in CD44 KO neurons. N = 100–120 neurons/group. (F) HC-HA/PTX3 did not change the intrinsic membrane property of small DRG neurons from CD44 KO mice. Upper: An example trace of membrane potential (Vm) which remained around resting level (−60 mV) after HC-HA/PTX3 (10 μg/ml). Lower: Quantification of the resting membrane potential (RMP) at 5 min after vehicle (saline) and HC-HA/PTX3 (p = 0.48). (G) Upper: Examples of traces of action potentials (APs) and rheobase evoked by injection of current in a small CD44 KO DRG neuron at 5 min after vehicle or HC-HA/PTX3 (10 μg/ml). Lower: Quantification of the rheobase levels (p = 0.2), AP threshold (p = 0.87), AP amplitude (p = 0.75), and duration (p = 0.82) in small DRG neurons from CD44 KO mice. N = 7–11/group. (H) Paw withdrawal latency (PWL) that was ipsilateral to the side of plantar-incision before and after an intra-paw injection of FLO (0.5 mg, 20 μl) or vehicle (saline, 20 μl) in CD44 KO mice (H, N = 8–9/group) after plantar-incision. (I) The ipsilateral PWL before and after an intra-paw injection of HC-HA/PTX3 (10 μg or 20 μg, 20 μl) or vehicle in CD44 KO mice after plantar-incision. N = 7–9/group. (J) The ipsilateral PWL before and after intra-paw injection of vehicle + control IgG, vehicle + CD44 IgG, HC-HA/PTX3 (10 μg) + control IgG, or HC-HA/PTX3 (10 μg) + CD44 IgG (all IgG at 10 μg, 10 μl) in WT mice after plantar-incision. N = 8–11/group. Data are mean ± SEM. (E) One-way ANOVA followed by Bonferroni post hoc test. ns = not significant. (F, G) Student’s t-test. (H–K) Two-way mixed model ANOVA followed by Bonferroni post hoc test. **p < 0.01 versus vehicle or saline + IgG; #p < 0.05 versus pre-drug.


