Table 2.
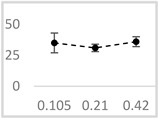
Inhibitory effect of selected organic solvents at final concentrations of 0.105 µmol/L, 0.21 µmol/L, and 0.42 µmol/L on UPE in 92.6 µmol/L Fe2+-185.2 µmol/L EGTA-2.6 mmol/L H2O2 system.
| Solvent | Chemical Structure | % Inhibition | Graph | ||
|---|---|---|---|---|---|
| 0.105 µmol/L | 0.21 µmol/L | 0.42 µmol/L | |||
| Methanol |

|
62 ± 4 * (62; 2) | 69 ± 8 * (65; 9) | 63 ± 4 * (64; 3) |
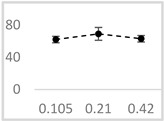
|
| Ethanol |

|
52 ± 3 * (52; 3) | 57 ± 2 * (57; 20 | 65 ± 1 * (64; 2) |
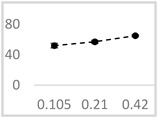
|
| Propan-1-ol |

|
65 ± 2 * (66; 2) | 67 ± 2 * (66; 3) | 64 ± 3 * (64; 4) |
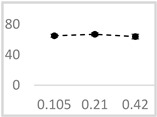
|
| n-Pentanol |

|
34 ± 6 * (32; 0) | 25 ± 5 * (26; 0) | 35 ± 2 * (32; 0) |
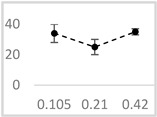
|
| Acetonitrile |

|
−1 ± 13 (2; 0) | 18 ± 3 * (19; 0) | 23 ± 5 * (21; 0) |
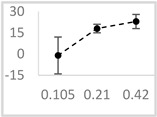
|
| DMSO |
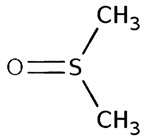
|
67 ± 2 * (67; 1) | 68 ± 7 * (67; 5) | 70 ± 2 * (71; 3) |
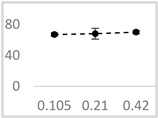
|
| Benzyl acetate |
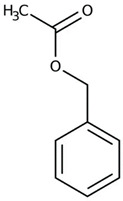
|
35 ± 8 * (35; 6) | 31 ± 3 * (31; 4) | 36 ± 4 * (37; 2) |
|
UPE—ultra-weak photon emission expressed in Relative Light Units (RLU). The tested solvent was mixed with EGTA and Fe2+, followed by the automatic injection of H2O2. The total light emission was then measured for 120 s. The results are presented as the mean and standard deviation (median; interquartile range) of the percentage inhibition of light emission, which was obtained from seven independent experiments. *—significant inhibition (p < 0.05) compared to the UPE of the Fe2+-EGTA-H2O2 system without the solvent.
