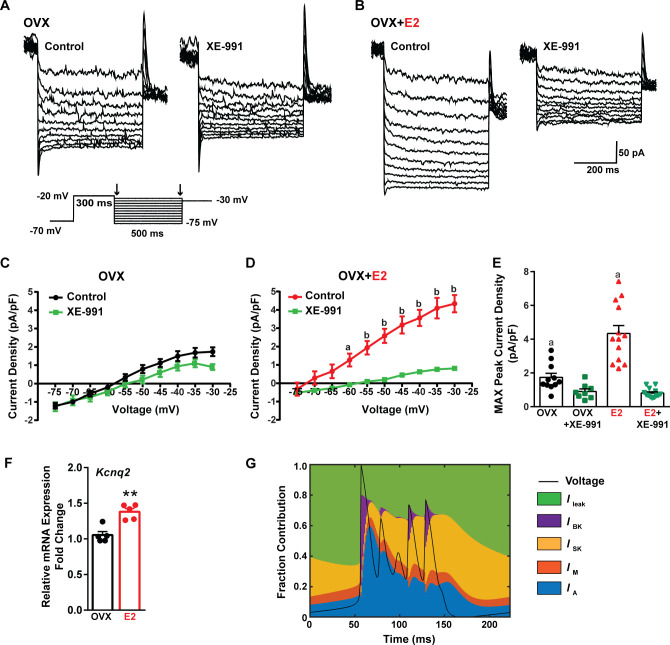
Figure 9. E2 upregulates Kcnq2 channels and M current in Kiss1ARH neurons.
(A, B) Representative current traces of the M current inhibition caused by 40 µM XE-991 perfused for 10 min in (A) OVX oil and (B) OVX + E2-treated female mice. Inset: M current deactivation protocol. (C, D) Current density–voltage plots from –75 to –30 mV of vehicle and XE-991 perfusion in (C) OVX oil and (D) OVX + E2-treated mice. Two-way ANOVA for (C): main effect of treatment (F(1, 17) = 1.908, p=0.1851), main effect of voltage (F(9, 153) = 187.1, p<0.0001) and interaction (F(9, 153) = 3.901, p=0.0002); Veh, n = 11; XE-991, n = 8; Bonferroni post hoc test, p>0.05. For (D): main effect of Veh and XE-991 (F(1, 24) = 24.92, p<0.0001), main effect of voltage (F(9, 216) = 174.5, p<0.0001) and interaction (F(9, 216) = 52.75, p<0.0001); Veh, n = 13; XE-991, n = 13; Bonferroni post hoc test, a = p<0.05, b = p<0.001. (E) Treatment with E2 elevated, while XE-991 diminished the maximum peak current density elicited by a –30 mV step in OVX- and OVX + E2-treated mice. Two-way ANOVA: main effect of Veh and XE-991 (F(1, 41) = 47.59, p<0.0001), main effect of OVX and OVX + E2 (F(1, 41) = 15.76, p=0.0003), and interaction F(1, 41) = 18.2, p=0.0001; Bonferroni post hoc test, Veh: OVX vs. OVX + E2, a = p<0.001. XE-991: OVX vs. OVX + E2, p>0.05. Data are expressed as mean ± SEM, with data points representing individual cells. (F) Kiss1ARH neurons (three 10-cell pools) were harvested from each of five vehicle- and five E2-treated, OVX females to quantify the mRNA expression of Kcnq2. E2 treatment increased the mRNA expression of Kcnq2. Unpaired t-test, t(8) = 4.850, **p=0.0013. Data are expressed as mean ± SEM, with data points representing individual animals. (G) Percent contribution of the different K+ currents to the repolarization current during burst-type firing activity in the OVX + E2 state. At each time point, the length of each color bar denotes the percent contribution of the corresponding current to the total outward current.

