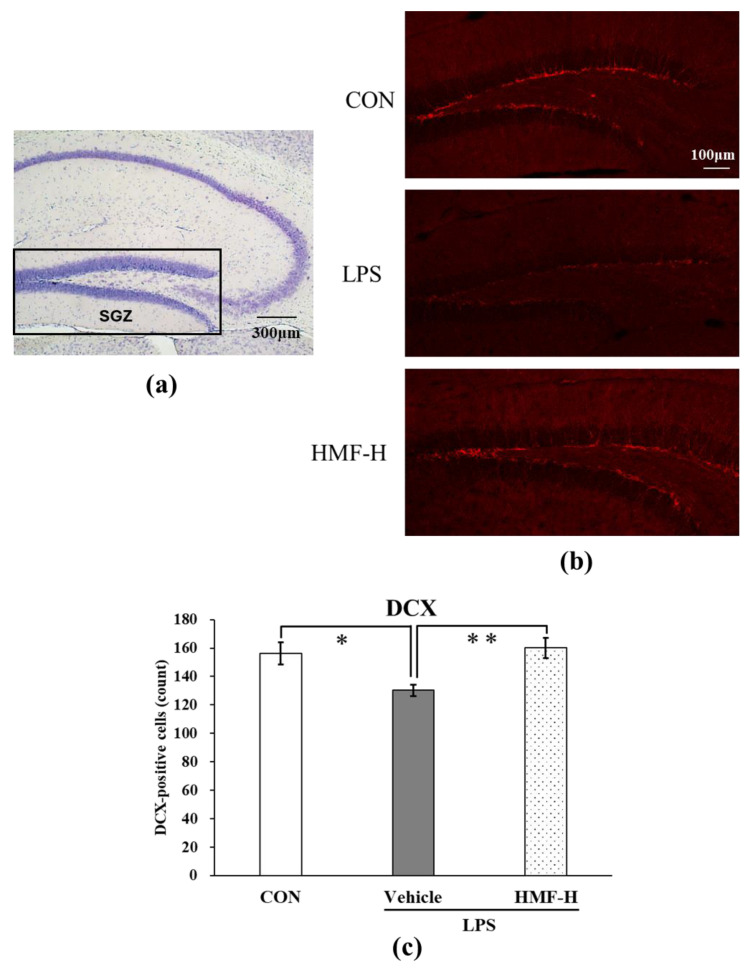
Figure 7.
The quantification of DCX in the subgranular zone (SGZ) of the hippocampus of chronic inflammation model mice. (a) The location of the captured images and quantification in the hippocampus is shown with a square. (b) Representative images of DCX stained with anti-DCX antibody. Scale bar = 100 μm. (c) The quantification of DCX-positive cells with nuclei in the SGZ of the hippocampus. Data were analyzed by performing a one-way ANOVA followed by Dunnett’s multiple comparison test. * p < 0.05 indicates a significant difference between CON and LPS; ** p < 0.01 indicates a significant difference between LPS and HMF-H. Values are represented as the mean ± SEM (n = 2 brain sections/mouse in each group).

