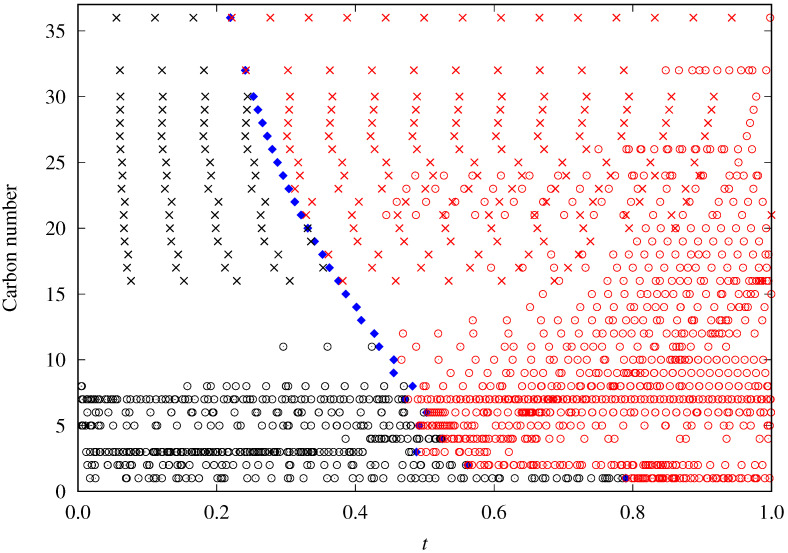
Figure 1.
Surface tension data availability as a function of the reduced temperature t and carbon number of the studied n-alkanes. Red symbols correspond to the data below the normal point temperature. Crosses (×) are those data predicted using Sugden’s correlation, whereas circles (∘) represent the rest of the selected data. Blue diamonds correspond to each fluid’s reduced normal boiling point temperature ().

