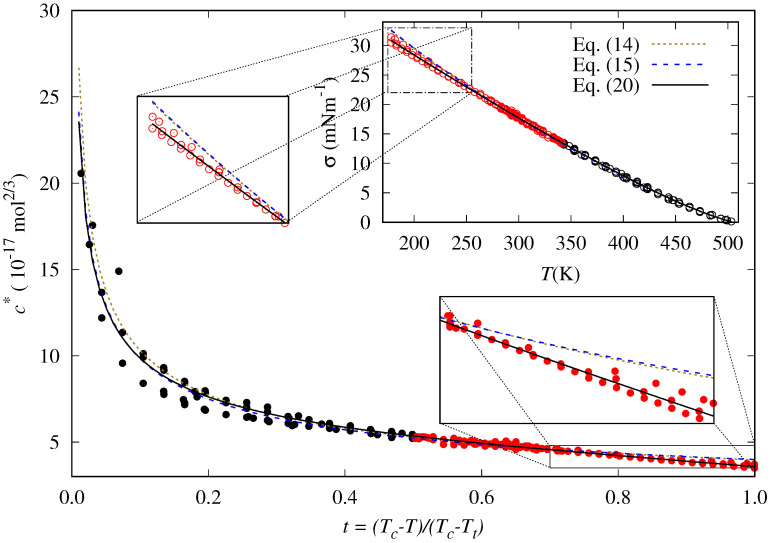
Figure 3.
Reduced influence parameter and surface tension for n-hexane (points) and our fits to the Zuo and Stenby correlation [35], Equation (14) (dotted lines); Cachadiña et al. proposal [72], Equation (15) (dashed blue lines); and the new correlation proposed in this work, Equation (20) (solid lines). The data at temperatures below the normal boiling point are shown in red. Results for the lower temperatures, i.e., higher reduced temperatures, are more clearly shown in the insets.

