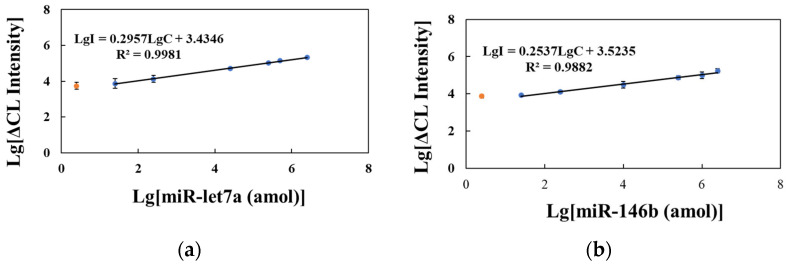
Figure 4.
Calibration curve of the hybridization chain reaction–chemiluminescence (HCR-CL) system. (a) Standard solution of miR-let7a; (b) Standard solution of miR-146b. ΔCL represents the CL intensity of the target miRNA subtracted from that of the blank (error bars: SD, n = 3). The orange dots represent the minimum detected amount of the target miRNA.

