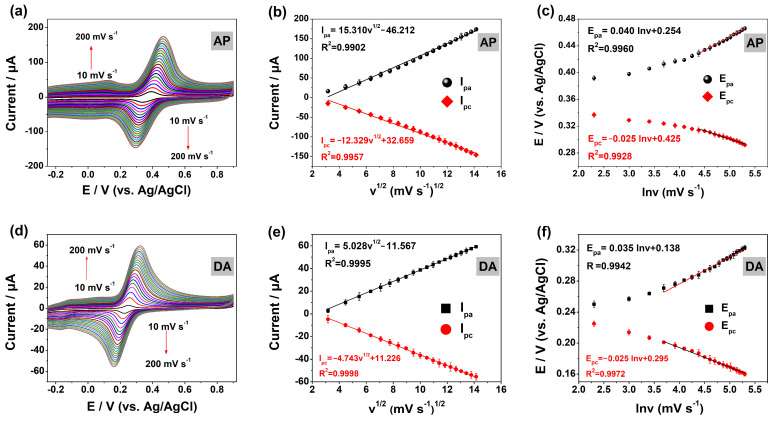
Figure 6.
CVs of (a) AP and (d) DA in PBS (0.1 M) with different scan rates (10–200 mV s−1, different colored lines represent different scan speeds, and the CV curve is scanned for every 10 mV s−1 increases in scan speed) on MOF-5@MWCNTs/GCE. Effect of scan rates on Ip and Ep for AP (b,c) and DA (e,f).

