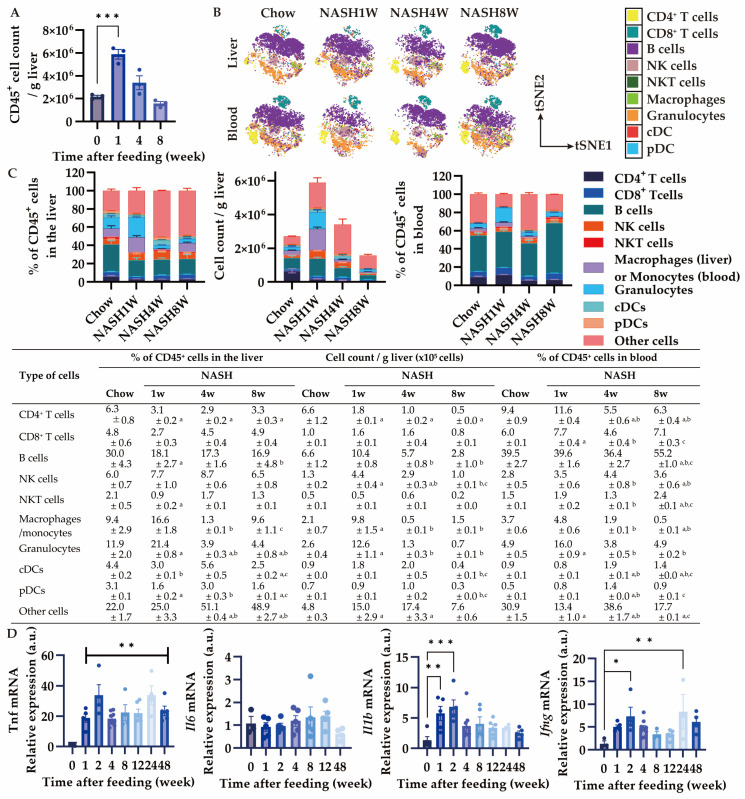
Figure 4.
Effects of MASH diet feeding on inflammation in the early stage. (A) Total number of CD45+ cells in the liver (n = 3); (B) representative images of profiling CD45+ cells in the liver and blood by CyTOF visualized by tSNE; (C) Percentage and the number of CD45+ cells in the liver and percentage of the CD45+ cells in the blood by CyTOF (n = 3); (D) the mRNA expression of Tnf, Il6, Il1b, and Ifng in the liver (n = 3–9). Zero weeks (0W) in the figure indicates Chow-diet-fed control mice. Values are presented as mean ± S.E.M. * p < 0.05, ** p < 0.01, and *** p < 0.001 vs. 0-week group in (A,C); a p < 0.05 vs. Chow group, b p < 0.05 vs. NASH1W, and c p < 0.05 vs. NASH4W group in (B). Statistical significance was calculated by a one-way ANOVA with (A,C) Dunnett’s post hoc test; (B) Tukey’s post hoc test.

