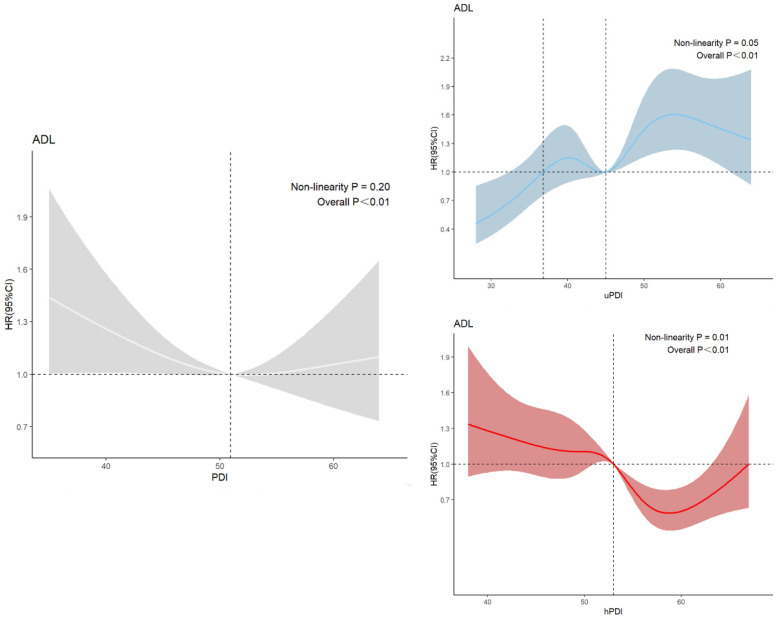
Figure 2.
Restricted cubic curves for PDI, uPDI, hPDI. Note: ADL refers to activities of daily living; PDI refers to Plant-Based Diet Index; hPDI refers to health Plant-Based Diet Index; uPDI refers to unhealthy Plant-Based Diet Index; HR refers to hazard ratio; CI refers to confidence interval. White lines indicate associations between PDI scores and ADL disability; blue lines indicate associations between uPDI and ADL disability; and red lines indicate associations between hPDI and ADL disability. Vertical dashed lines indicate the PDI, hPDI, and uPD scores on the x-axis for HR values of 1. Shaded areas are 95% confidence intervals.

