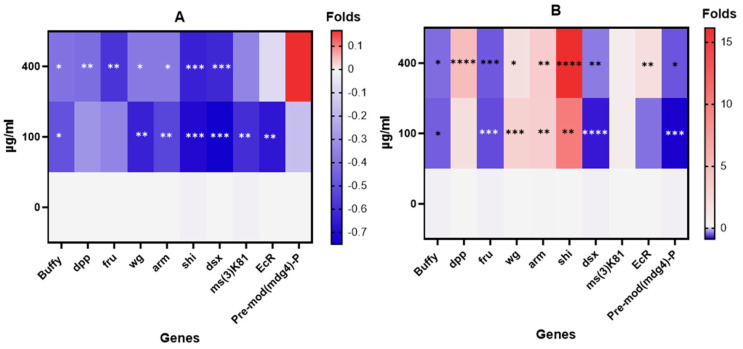
Figure 12.
Heat map of gene expression profile for the 10 selected genes. Different behavior between males and females is observed. While females (A) show underexpression for all the cases, males (B) overexpress arm, dpp, EcR, shi, and wg genes. Multiple pairwise comparisons were performed using ordinary one-way ANOVA (Dunnett’s test). * p < 0.05, ** p < 0.01. *** p < 0.001, **** p < 0.0001.

