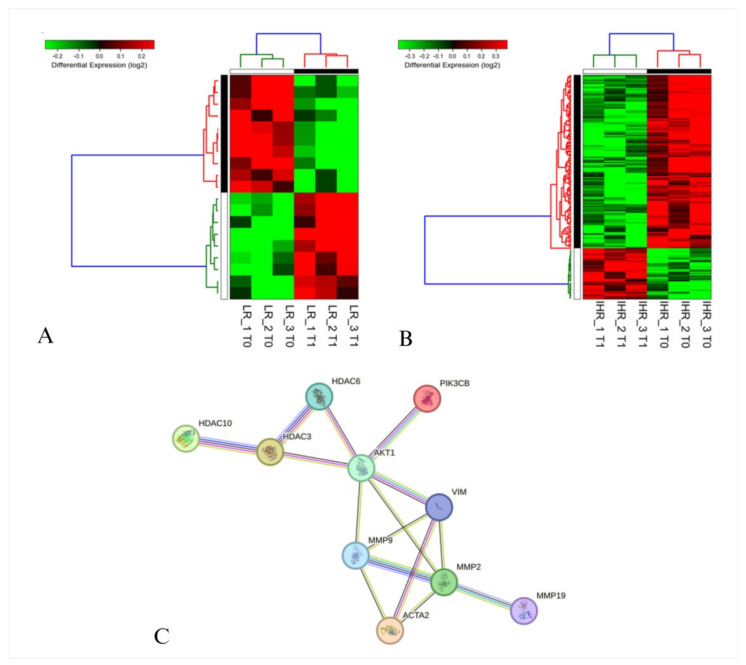
Figure 4.
Gene expression analysis of HEPA-RG after stimulation with patient-derived sEVs before (T0) and after (T1) treatment for 8 weeks of VLCKD, using samples from both LR (A) and IHR (B) patients. Each row represents a gene, while each column corresponds to a sample. Relative expression levels are depicted using a color-coded scale, with red indicating high expression and green indicating low expression, as shown in the scale provided at the top. An interaction network (C) was constructed using the Search Tool for the Retrieval of Interacting Genes/Proteins (STRING). In this network, nodes represent proteins, and edges indicate predicted functional associations based on seven distinct sources of evidence: fusion events, neighborhood relationships, co-occurrence, experimental data, text mining, database information, and co-expression patterns. The color scheme is as follows: light blue indicates curated databases; light pink denotes experimentally determined interactions; gray represents co-expression; yellow signifies gene neighborhood; orange indicates gene fusions; blue denotes gene co-occurrence; green represents text mining; and purple indicates protein homology.

