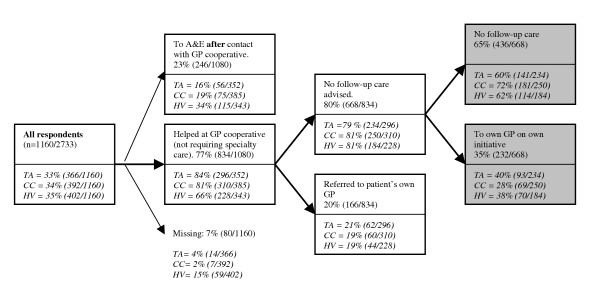
Figure 1.
Flow chart of patient follow-up care after contact with the GP cooperative for out-of-hours care. Grey boxes represent data on which the logistic regression has been performed. (TA = telephone advice; CC = consultation at the GP cooperative; HV = home visit; A&E = Accident and Emergency department)

