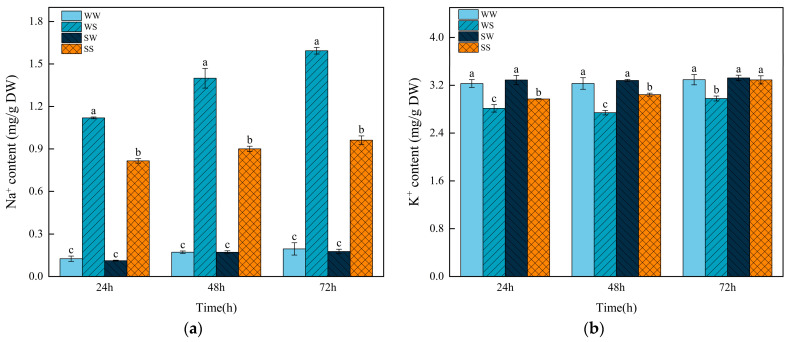
Figure 9.
Effects of SA treatment on the Na+ and K+ contents in the wheat progeny seeds under salt stress. (a) Na+ content; (b) K+ content. WW (water pretreatment + water germination), WS (water pretreatment + NaCl treatment), SW (150 µmol/L SA pretreatment + water germination), SS (150 µmol/L SA pretreatment + NaCl treatment). Each value is the mean ± SE of three biological replicates. The different lowercase letters indicate statistically significant differences at the p < 0.05 level.

