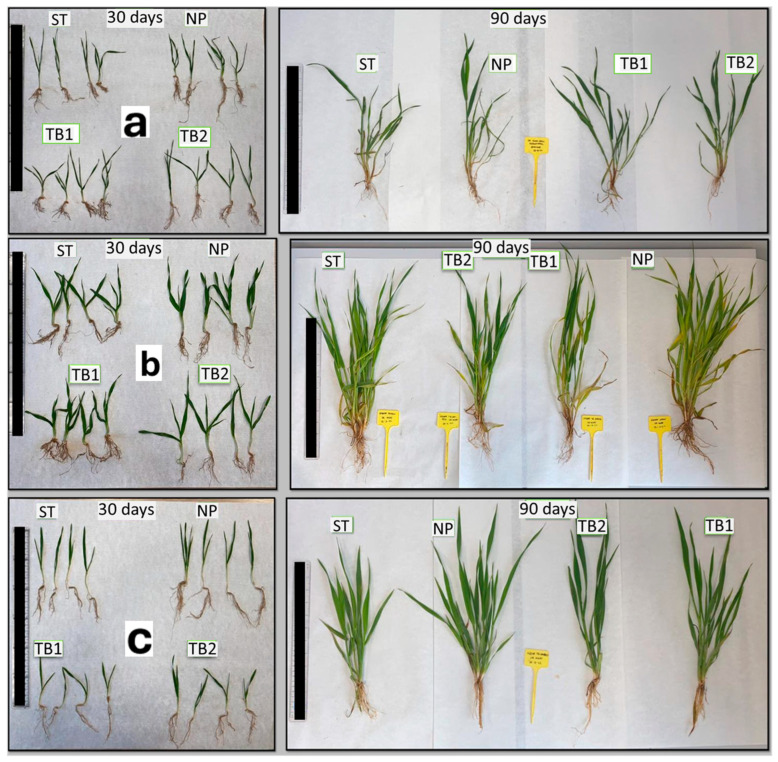
Figure 3.
Morphological analysis of the different samples: (a) wheat, (b) barley, and (c) oat plants. On the left, samples were obtained 30 days after sowing; on the right, samples were obtained 90 days after sowing. C: control (untreated); NP: treated with GE-NPCH; TB1: treated by spraying with TB; TB2: seeds treated by the seed grower. Scale bar = 30 cm.

