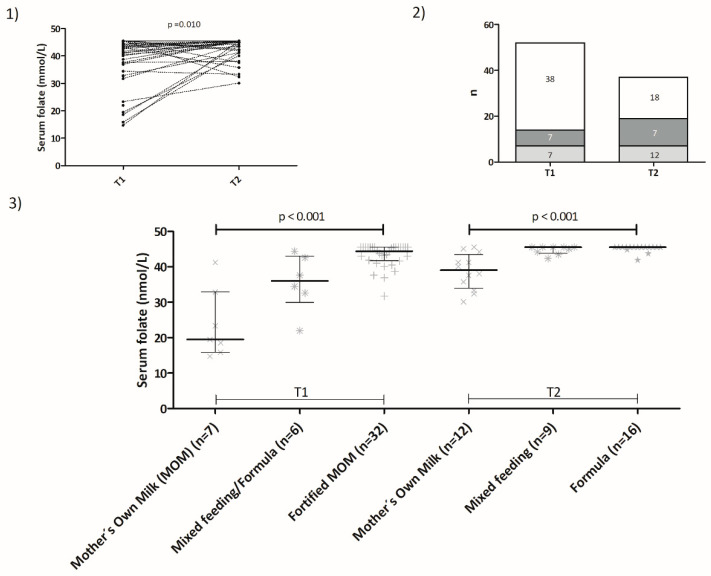
Figure 1.
Folate status in preterm infants. (1) Serum folate concentrations for each participant at T1 (pre-discharge) and at T2 (follow-up). The dotted lines link the folate concentrations for each patient at each time point. Concentrations were significantly higher at T2 (n = 37 pairs, T1 mean 38.9, SD 9.1 nmol/L; T2 mean 43.0, SD 4.2 nmol/L, p = 0.01, repeated measures t-test). (2) Percentage and number of participants with folate concentrations that were normal, elevated at one time point, or elevated at both time points are represented by the white, light gray, and dark gray areas on the bars, respectively. (3) Serum folate concentrations according to feeding type at T1 and T2. Each individual symbol (x, ✴, +, ★) represents one data point for each feeding category. Lines and error bars represent medians and interquartile ranges, respectively. Mother’s Own Milk (MOM).

