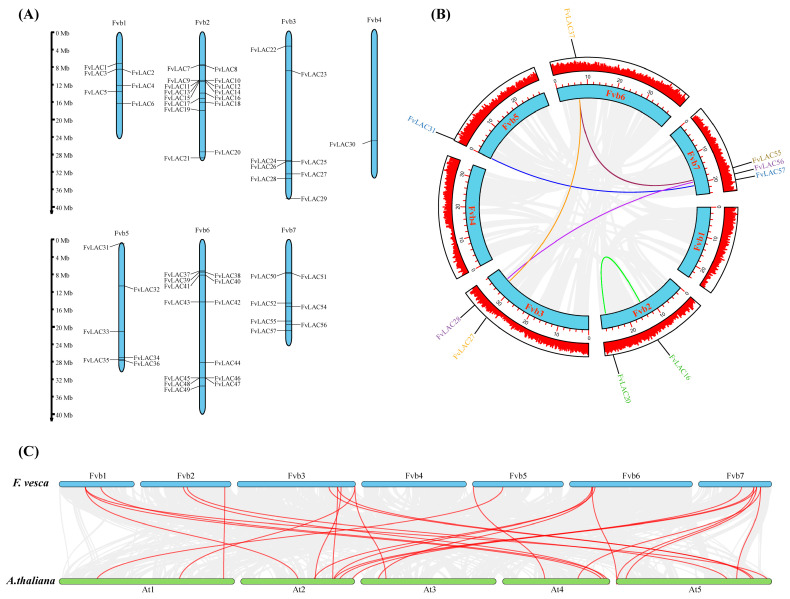
Figure 2.
Chromosome distribution and collinearity analysis of FvLACs. (A) Chromosomal localization of 57 FvLAC genes. The chromosome numbers are indicated at the top of each chromosome image, and the scale on the left is in mega-bases. (B) Collinearity relationship analysis of the FvLAC gene family. The colored lines indicate duplicated FvLAC gene pairs. (C) Synteny analysis of LACs between A. thaliana and F. vesca. Gray lines in the background indicate all the collinear blocks, and red lines highlight the syntenic LAC gene pairs.

