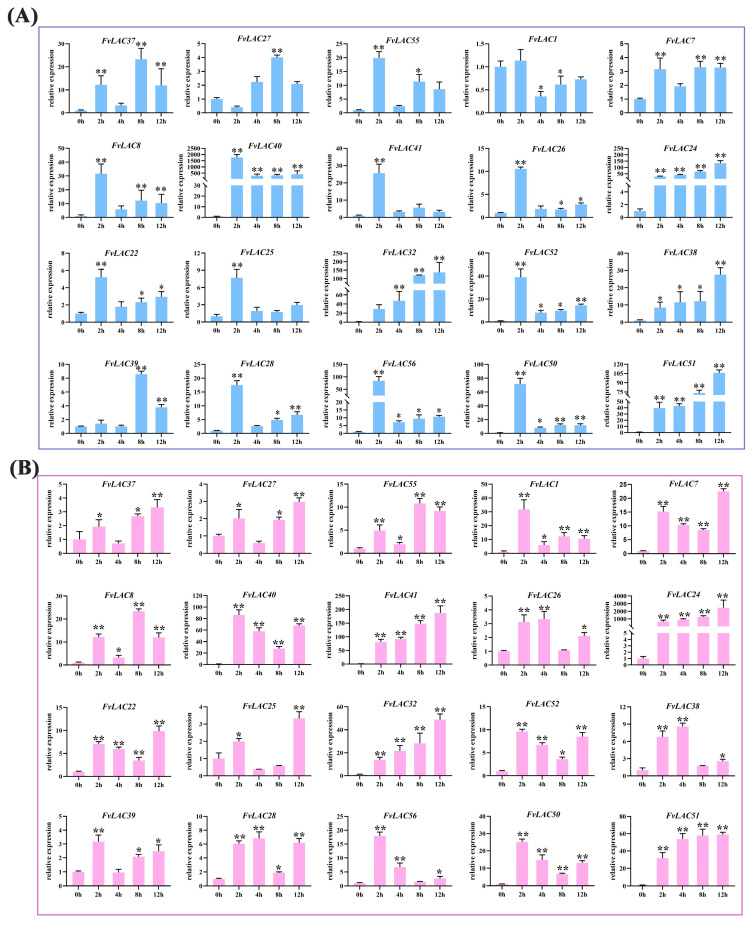
Figure 5.
Expression analysis of 20 FvLAC genes under ABA and MeJA treatments by qRT-PCR. (A) The 20 FvLACs’ expression levels in seedlings under 40 µmol/L ABA treatments. (B) The 20 FvLACs’ expression levels in seedlings under 40 µmol/L MeJA treatments. Error bars indicate standard deviations among three independent biological replications. FvActin was used as the internal control, 0 h was used as the mock, and t-test was used to analyze three biological replicates of each sample. *: p-value < 0.05, **: p-value < 0.01.

