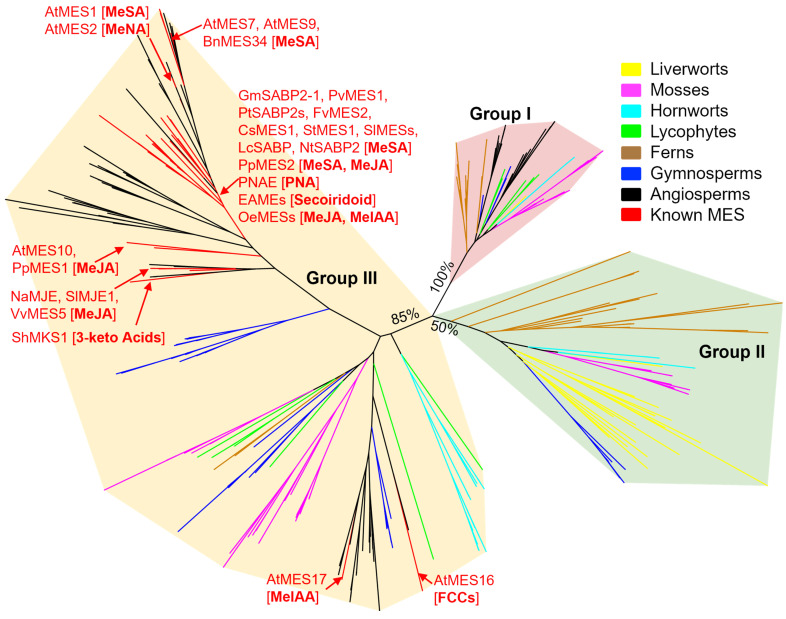
Figure 3.
Phylogenetic analysis of MES proteins from 21 genomes representing various land plant taxa, plus all characterized MESs. Branches are color-coded as follows: liverworts, yellow; mosses, magenta; hornworts, cyan; lycophytes, green; ferns, brown; gymnosperms, blue; angiosperms, black; known MESs, red. Characterized MES members are indicated as red labels, with their substrates in brackets. The phylogenetic tree was constructed with RAxML (version 1.1.0) using the best-fit model LG + G4 + F with 1000 bootstrap replicates. Bootstrap support for the major groups is indicated. The tree was visualized and further annotated using iTOL (version 6.9.1).

