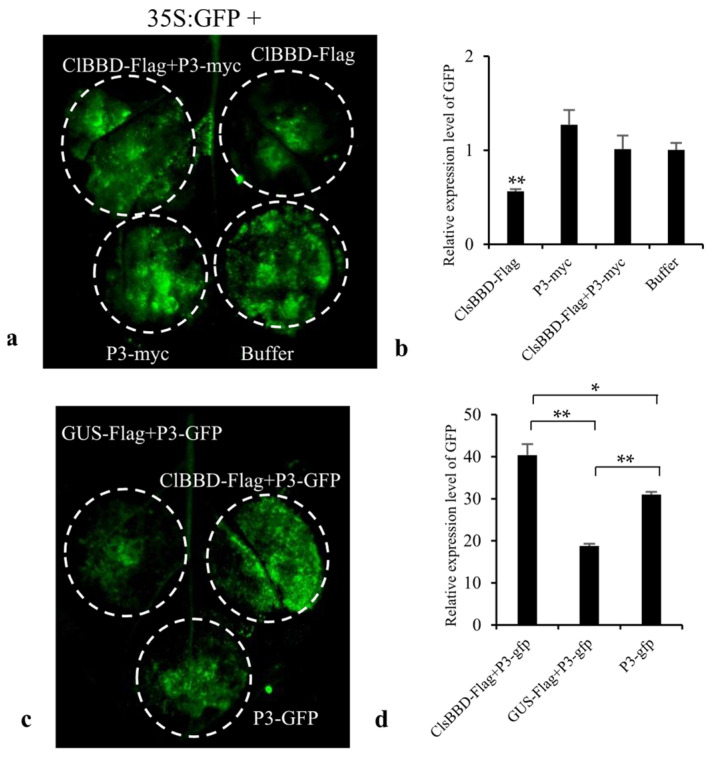
Figure 5.
The test of ClBBD regulating the expression of P3. (a) Transient co-expression of ClBBD-Flag, ClBBD-Flag plus P3-myc, P3-myc, or Buffer with 35S:GFP in N. benthamiana. (b) RT-qPCR analysis of relative GFP mRNA levels. (c) Transient co-expression of ClBBD-Flag or GUS-Flag with P3-GFP, and only P3-GFP in N. benthamiana. (d) qRT-PCR analysis of relative P3-GFP mRNA levels. (e) Western blot assay of the P3 protein level through expressing transiently of P3-myc alone, or co-expression of P3-myc with ClBBD-Flag, or co-expression of P3-myc with GUS-Flag in N. benthamiana. The constructs GUS-Flag, ClBBD-Flag, P3-GFP and P3-myc were generated using the pCAMBIA1300 vector, and 35S:GFP was constructed using PCB301 vector. Bars represent mean ± SD calculated from three independent biological samples. Asterisks indicate the significant difference; * and ** represent p < 0.05 and 0.01, respectively.


