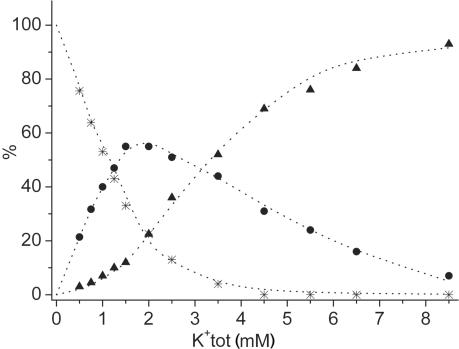
Figure 5.
Relative concentrations of the three di-cation forms of d(G3T4G4)2 as a function of total concentration of K+ ions. Stars, circles and triangles represent experimental relative concentrations of (1), mixed (2) and di-K+ (3) forms, respectively. Dotted curves represent the best fits of the experimental data to Equations 1 and 2. The maximum individual discrepancy between experimental and calculated fractions of 1–3 was 5 unit%, whereas root-mean-square deviation was 2 unit%.

