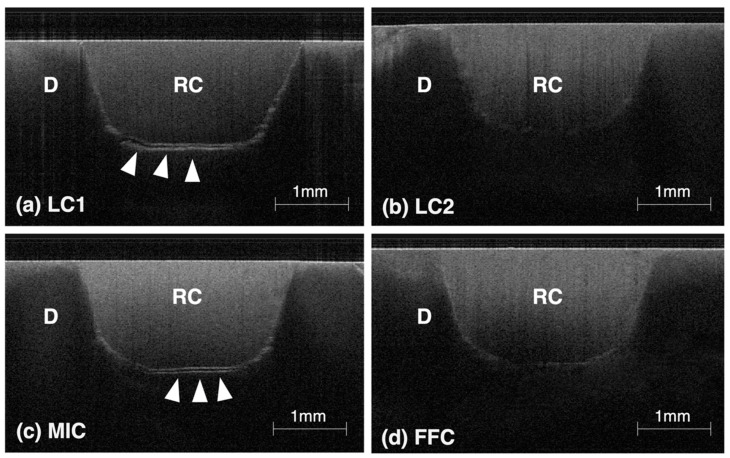
Figure 6.
Representative SS-OCT images for evaluating marginal adaptation: In these images, “RC” denotes the resin core material, and “D” stands for dentin. Interface delamination and voids manifest as strong signals, visible as white lines. In groups LC1 (a) and MIC (c), many samples displayed pronounced gap formation (indicated by white arrows). Conversely, while the LC2 (b) and FFC (d) groups demonstrated regions of increased brightness, no samples showed distinct signs of delamination.

