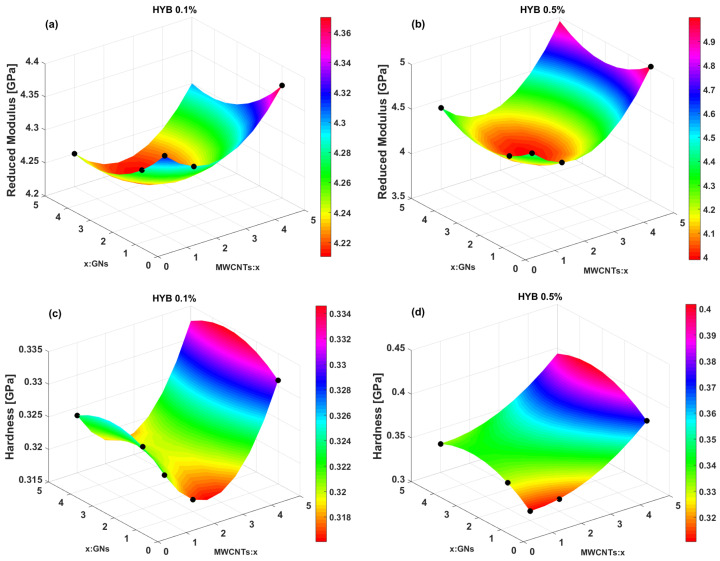
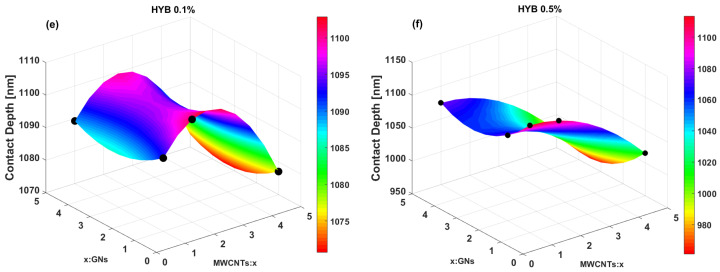
Figure 14.
Response surface plots representing the mechanical properties of the two HYB formulations. Subplots (a,b) display the reduced modulus for the 0.1% and 0.5% HYB compositions, respectively. Subplots (c,d) illustrate the hardness values for each formulation, while (e,f) depict the contact depth. Experimental data points are marked with black dots, demonstrating the fit of the surface to the measured values. The color bar in each subplot shows the range of variability for each property.


