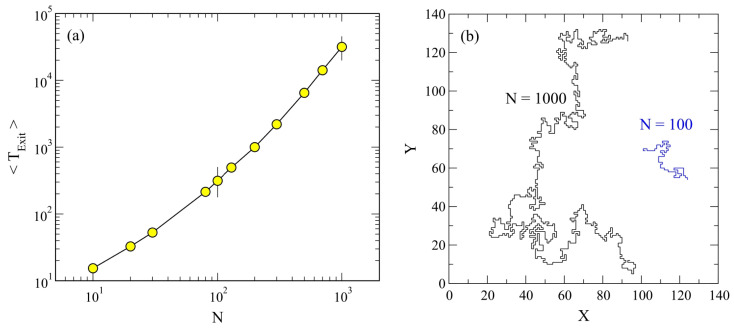
Figure 33.
(a) Mean exit time steps, , to generate a reptation SAW configuration vs. N. The continuous line is a guide to the eyes, and the vertical lines are included for illustration, representing a standard deviation. The numerical data can be well fitted with the form, , for . Averages over SAW configurations have been performed for the case steps and lattice size . (b) Reptating SAWs on a square lattice illustrated in the cases: and monomers.

