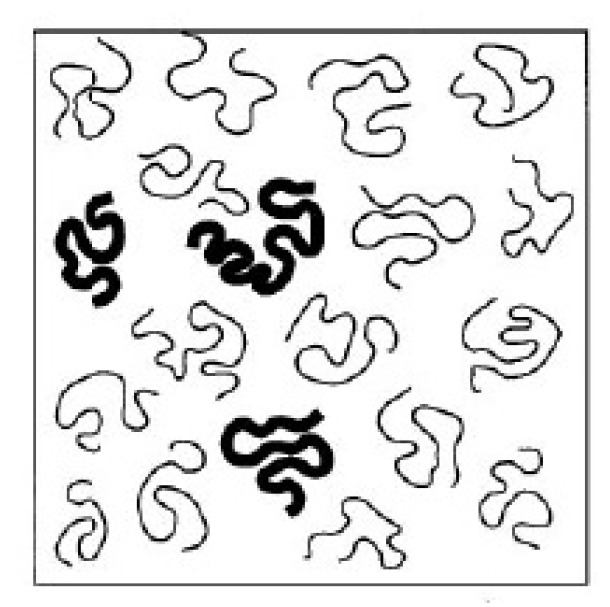
Figure 37.

A cartoon of the type of collapsed DNA chain observed in the experiments. The thick lines represent fluorescently labeled DNA molecules, while the thin lines the remaining ones in the sample studied. The former are the actually observed DNA chains (adapted from [360]).
